Average Home Price in Albuquerque NM (2026): Trends & Data
$359,583. That’s what a typical home costs in Albuquerque as of February 2026. Prices are up 0.5% from a year ago — barely keeping pace with inflation. If you’re shopping for a house here, you’re looking at a market that’s flat in real terms.
Quick answer: The average home price in Albuquerque, NM is $359,583 as of February 2026, up 0.5% year over year according to Zillow.
Current Home Prices in Albuquerque
Here’s where the Albuquerque housing market stands right now:
| Metric | Value |
|---|---|
| Median Home Value | $359,583 |
| Year-over-Year Change | +0.5% |
| Lowest ZIP Code Value | $241,332 |
| Highest ZIP Code Value | $738,030 |
| Number of ZIP Codes Tracked | 16 |
A half-percent annual gain is essentially flat. After years of rapid post-pandemic appreciation in many Sun Belt markets, Albuquerque has settled into a holding pattern.
The price range tells a more interesting story. The gap between the cheapest and most expensive ZIP codes is nearly $497,000. That spread means your budget determines not just the size of your home but which part of the city you live in entirely.
The metro-wide median of $359,583 puts Albuquerque well below the national median, which hovered near $400,000 through late 2025. For buyers priced out of Denver, Phoenix, or Austin, Albuquerque remains one of the more accessible markets in the western U.S.
But “accessible” doesn’t mean “cheap.” A $360K mortgage still requires meaningful income, especially at current interest rates. At 7% with 20% down, you’re looking at roughly $1,913 per month in principal and interest alone — before taxes, insurance, and maintenance.
Albuquerque Home Prices by Neighborhood
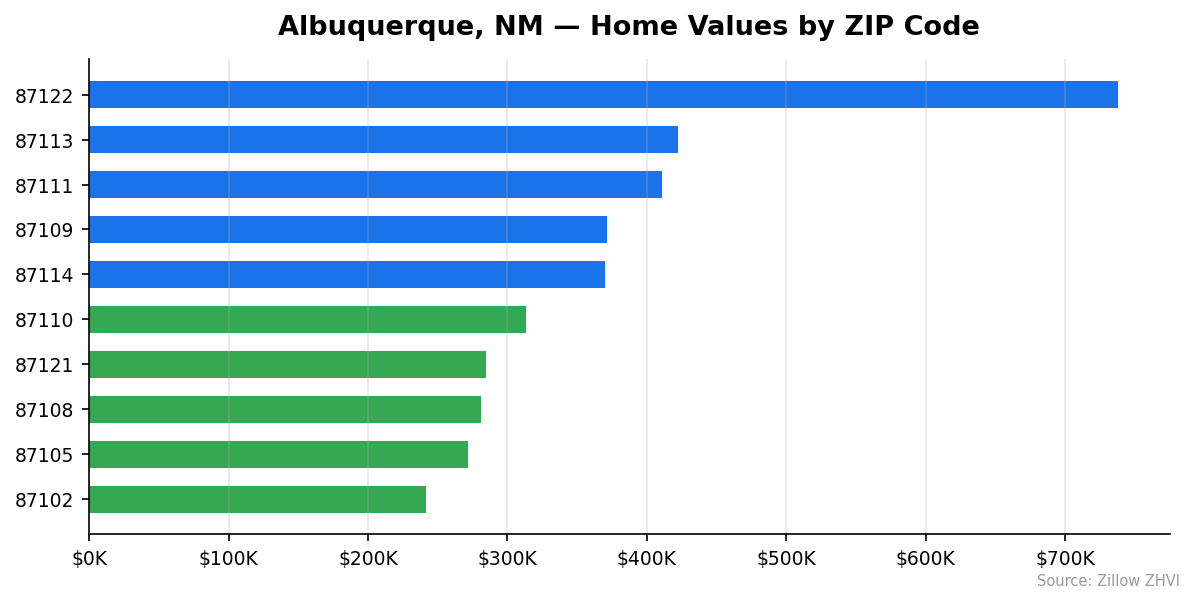
Not all of Albuquerque costs the same. Here’s how the city’s 16 tracked ZIP codes stack up:
| ZIP Code | Median Home Value |
|---|---|
| 87122 | $738,030 |
| 87113 | $422,321 |
| 87111 | $411,146 |
| 87109 | $371,558 |
| 87114 | $369,866 |
| 87106 | $363,456 |
| 87120 | $353,285 |
| 87104 | $343,033 |
| 87107 | $338,415 |
| 87123 | $335,713 |
| 87112 | $314,881 |
| 87110 | $313,316 |
| 87121 | $284,782 |
| 87108 | $280,732 |
| 87105 | $271,464 |
| 87102 | $241,332 |
ZIP 87122 is a clear outlier at $738,030 — more than double the city median. This is the Four Hills and Tramway area on the east side, and it operates almost like a separate market.
On the other end, 87102 comes in at $241,332. That’s downtown and the surrounding neighborhoods. At roughly $100K less than the cheapest suburbs, it’s the entry point for Albuquerque homeownership.
The middle of the market clusters between $310K and $370K. That’s where most buyers are competing. Ten of the 16 ZIP codes fall in that range, which means inventory and competition are concentrated there.
Rent vs Buy in Albuquerque
Here’s what renting looks like across Albuquerque’s neighborhoods:
| ZIP Code | Median Home Value | Avg Monthly Rent |
|---|---|---|
| 87122 | $738,030 | $2,107 |
| 87113 | $422,321 | $1,967 |
| 87114 | $369,866 | $1,658 |
| 87121 | $284,782 | $1,640 |
| 87120 | $353,285 | $1,521 |
| 87110 | $313,316 | $1,499 |
| 87111 | $411,146 | $1,494 |
| 87112 | $314,881 | $1,449 |
| 87104 | $343,033 | $1,418 |
| 87109 | $371,558 | $1,378 |
| 87123 | $335,713 | $1,267 |
| 87106 | $363,456 | $1,224 |
| 87107 | $338,415 | $1,218 |
| 87121 | $284,782 | $1,640 |
| 87102 | $241,332 | $1,113 |
| 87108 | $280,732 | $1,059 |
Average rent across these ZIP codes runs about $1,467 per month.
Now compare that to buying. On the median-priced $359,583 home with 20% down and a 7% mortgage rate, your monthly principal and interest payment is approximately $1,913. Add property taxes and insurance, and you’re likely above $2,200.
That’s a gap of at least $730 per month between renting and buying. Renting is the cheaper option on a pure cash-flow basis. But renters build no equity. If prices rise even modestly — as the 0.5% YoY gain suggests — buyers recoup some of that monthly premium over time.
The rent-to-price ratio varies wildly by neighborhood. In 87108, rent is $1,059 on a $280,732 home. In 87122, rent is $2,107 on a $738,030 home. The expensive neighborhoods are actually better deals for renters relative to purchase price.
Population Growth and Migration
Albuquerque is losing residents. The city’s population dropped from 564,885 in 2020 to 560,326 in 2024 — a decline of 0.8% over four years.
| Year | Population |
|---|---|
| 2020 | 564,885 |
| 2021 | 563,441 |
| 2022 | 561,422 |
| 2023 | 561,094 |
| 2024 | 560,326 |
The loss has been gradual — about 1,100 people per year. Not a collapse, but a consistent downward trend.
Meanwhile, smaller cities in New Mexico are growing:
| City | 2024 Population | 4-Year Growth |
|---|---|---|
| Rio Rancho | 112,524 | +7.7% |
| Las Cruces | 116,998 | +4.7% |
| Santa Fe | 90,551 | +3.2% |
Rio Rancho, Albuquerque’s suburban neighbor, grew 7.7% in the same period Albuquerque shrank. That pattern — core city shrinks, suburbs and satellite cities grow — suggests people aren’t leaving New Mexico. They’re leaving Albuquerque proper.
For housing, population decline should limit price growth. Fewer people means less demand. The fact that prices still edged up 0.5% despite population loss suggests constrained supply or incoming out-of-state buyers may be offsetting local departures.
Albuquerque Housing Market Trends
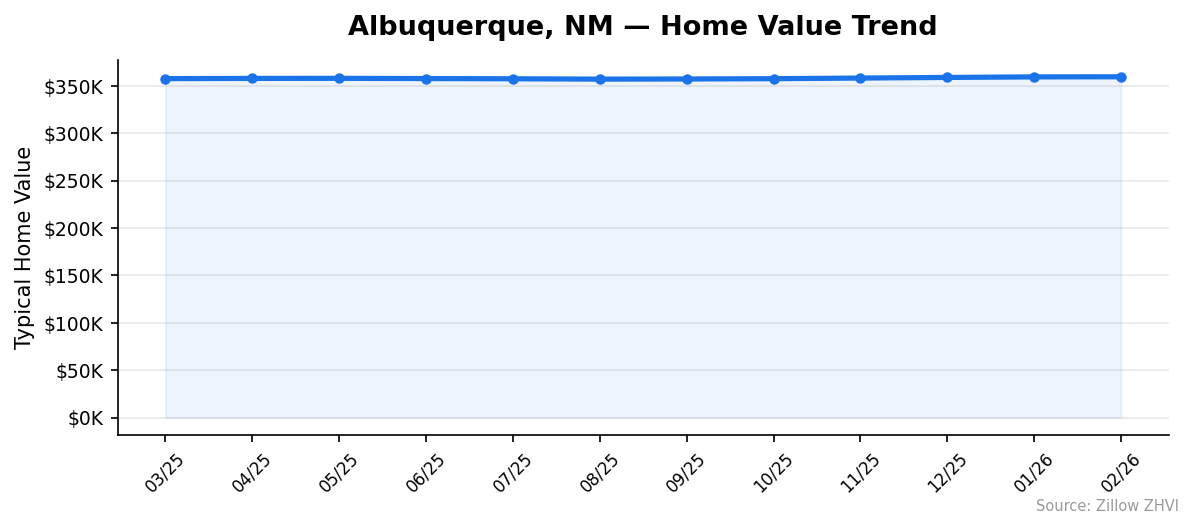
Here’s how the average home price in Albuquerque moved over the past 12 months:
| Month | Avg Home Value | Min (ZIP) | Max (ZIP) |
|---|---|---|---|
| Feb 2026 | $359,583 | $241,332 | $738,030 |
| Jan 2026 | $359,459 | $241,601 | $738,867 |
| Dec 2025 | $358,902 | $241,633 | $738,171 |
| Nov 2025 | $358,246 | $241,844 | $736,690 |
| Oct 2025 | $357,581 | $242,012 | $734,701 |
| Sep 2025 | $357,268 | $242,284 | $733,382 |
| Aug 2025 | $357,114 | $241,902 | $732,861 |
| Jul 2025 | $357,479 | $241,773 | $733,858 |
| Jun 2025 | $357,715 | $241,496 | $734,167 |
| May 2025 | $357,947 | $241,286 | $734,111 |
| Apr 2025 | $357,866 | $240,556 | $732,857 |
| Mar 2025 | $357,641 | $239,838 | $731,365 |
The trend breaks into two phases. From March to August 2025, prices dipped slightly — falling from $357,641 to $357,114. That $527 decline was barely noticeable.
Then starting in September, prices began a slow climb. From $357,268 in September to $359,583 in February 2026, the market added about $2,300 over five months.
Total movement over the full 12 months: less than $2,000. That’s a market moving sideways. The floor (cheapest ZIP) held steady around $241K all year. The ceiling (most expensive ZIP) rose from $731,365 to $738,030 — a $6,665 gain that outpaced the overall market.
The expensive neighborhoods are pulling away from the rest.
Is Albuquerque a Good Place to Buy in 2026?
The numbers paint a picture of stability, not opportunity.
A 0.5% annual gain means your home barely appreciates in real terms. You won’t get rich from Albuquerque price appreciation right now. But you also won’t lose your shirt — prices haven’t dropped in any month over the past year.
For buyers, the math works if you plan to stay. A $360K home with slow appreciation still builds equity through mortgage payments. And monthly costs are far lower than comparable western cities.
For investors, the rent-to-price ratios are middling. At a $1,467 average rent on a $360K property, gross yields hover around 4.9% before expenses. Not terrible, but not a cash-flow play either.
The population decline is worth watching. If Albuquerque continues to lose residents while Rio Rancho and Las Cruces gain, demand pressure could weaken further. But the flat pricing suggests the market has already priced in slow growth.
If you’re buying a home to live in for five or more years, Albuquerque’s stability works in your favor. If you’re speculating on rapid appreciation, look elsewhere.
Albuquerque Housing Market Outlook for 2026-2027
The three-month trend from December 2025 to February 2026 shows prices rising about $227 per month. If that pace continues through mid-2026, expect the median to reach roughly $360K–$362K by summer.
That’s not dramatic growth. It’s a market grinding higher by small increments.
The seasonal pattern from 2025 offers a clue. Prices softened slightly during summer months (June through August) before picking up in fall and winter. If that cycle repeats, you could see a brief plateau or minor dip mid-year before prices resume their slow climb.
The 12-month trend suggests no major correction is coming from the data available. There’s no sharp acceleration or deceleration. Albuquerque looks set for another year of sub-1% gains — stable and unremarkable.
Frequently Asked Questions
What is the average home price in Albuquerque?
The average home price in Albuquerque is $359,583 as of February 2026. This figure represents the typical home value across 16 tracked ZIP codes, ranging from $241,332 to $738,030.
Are home prices going up or down in Albuquerque?
Prices are going up, but slowly. The year-over-year increase is 0.5%. Over the past 12 months, the median home value rose less than $2,000 — essentially a flat market.
Is it cheaper to rent or buy in Albuquerque?
Renting is cheaper on a monthly basis. Average rent is about $1,467 per month. A mortgage on the median home (20% down, 7% rate) costs roughly $1,913 in principal and interest — and more after taxes and insurance. The gap is at least $730 per month.
What is the most affordable neighborhood in Albuquerque?
ZIP code 87102, covering the downtown area, has the lowest median home value at $241,332. That’s about $118,000 below the city-wide median and the only ZIP under $270K.
Is Albuquerque growing or shrinking?
Albuquerque is shrinking. The population fell from 564,885 in 2020 to 560,326 in 2024, a 0.8% decline. Nearby cities like Rio Rancho (+7.7%) and Las Cruces (+4.7%) are growing over the same period.
Methodology
Home values are based on the Zillow Home Value Index (ZHVI), a smoothed measure of typical home values in the 35th to 65th percentile range. Rent estimates use the Zillow Observed Rent Index (ZORI). Population figures come from the U.S. Census Bureau Population Estimates Program (2020–2024 vintage). All datasets are publicly available. Housing data updated 2026-02-28.