Average Home Price in Austin TX (2026): Trends & Data
$567,739. That’s what a typical home costs in Austin right now. A year ago, you’d have paid about $23,000 more. Prices have fallen 4.0% year over year, and the slide has been steady — every single month for the past twelve.
Quick answer: The average home price in Austin, TX is $567,739 as of February 2026, down 4.0% year over year according to Zillow.
Current Home Prices in Austin
The Austin housing market has cooled off. The median home value sits at $567,739 for February 2026, marking a full year of consecutive monthly declines.
| Metric | Value |
|---|---|
| Median home value | $567,739 |
| Year-over-year change | -4.0% |
| Lowest ZIP code value | $276,222 |
| Highest ZIP code value | $1,276,424 |
| ZIP codes tracked | 39 |
| Data as of | February 2026 |
The gap between Austin’s cheapest and most expensive neighborhoods is enormous — a factor of nearly 5x. You can buy a home in 78725 for well under $300,000, or spend over $1.2 million in 78703.
That -4.0% annual decline translates to roughly $23,400 in lost value on the median home. For homeowners who bought at the peak, the sting is real. For buyers sitting on the sidelines, the math is finally shifting.
The decline hasn’t been dramatic on a month-to-month basis. February’s median dropped just $1,558 from January. But strung together over twelve months, the trend is unmistakable.
Austin Home Prices by Neighborhood
Not all Austin ZIP codes are moving in the same direction or at the same speed. Here are the ten most expensive and ten most affordable neighborhoods.
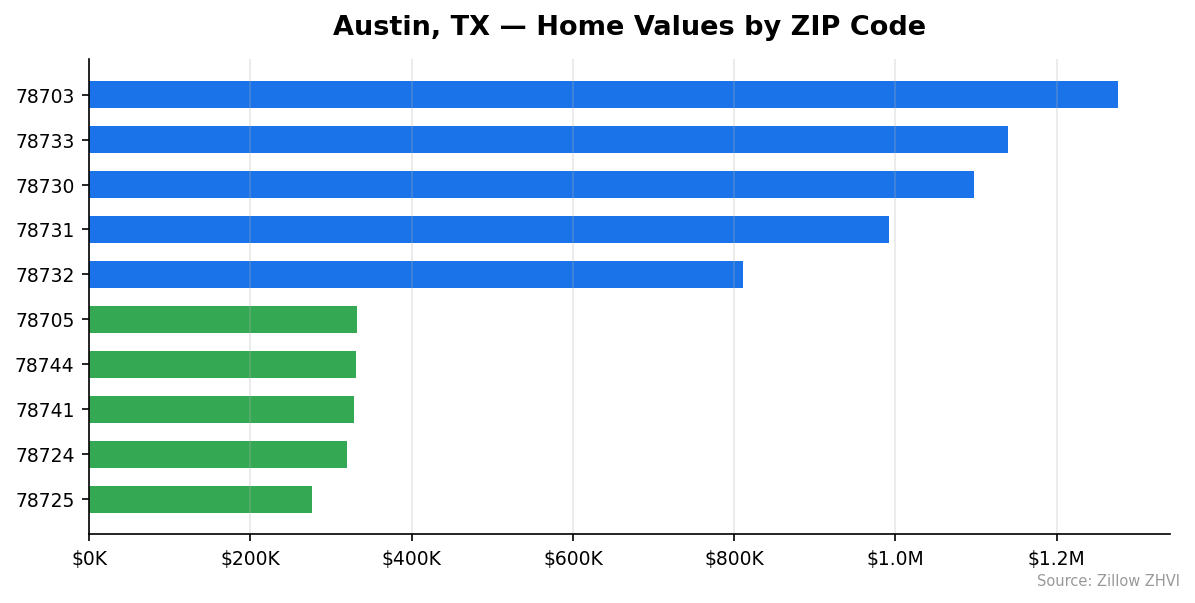
Most Expensive ZIP Codes
| ZIP Code | Typical Home Value |
|---|---|
| 78703 | $1,276,424 |
| 78733 | $1,140,278 |
| 78730 | $1,097,495 |
| 78731 | $992,079 |
| 78732 | $810,532 |
| 78739 | $793,215 |
| 78737 | $772,024 |
| 78704 | $715,183 |
| 78726 | $698,789 |
| 78756 | $688,895 |
Most Affordable ZIP Codes
| ZIP Code | Typical Home Value |
|---|---|
| 78725 | $276,222 |
| 78724 | $319,450 |
| 78741 | $329,033 |
| 78744 | $330,421 |
| 78705 | $332,733 |
| 78753 | $335,021 |
| 78754 | $360,572 |
| 78747 | $363,158 |
| 78758 | $365,285 |
| 78752 | $370,842 |
The west side of Austin dominates the expensive list. 78703 — the Tarrytown and Old Enfield area — tops $1.27 million. Meanwhile, the most affordable options cluster east and south of downtown. 78725 offers entry into Austin homeownership at $276,222, less than half the citywide median.
If you’re priced out of central Austin, the eastern ZIP codes are where your dollar stretches furthest.
Rent vs Buy in Austin
Renting is cheaper than buying in Austin on a pure monthly-cost basis — and it’s not close.
Here’s what rents look like across a sample of Austin ZIP codes:
| ZIP Code | Typical Monthly Rent | Typical Home Value |
|---|---|---|
| 78739 | $3,006 | $793,215 |
| 78701 | $2,923 | $675,278 |
| 78703 | $2,512 | $1,276,424 |
| 78702 | $1,931 | $550,888 |
| 78757 | $1,860 | $585,015 |
| 78723 | $1,838 | $466,998 |
| 78741 | $1,382 | $329,033 |
| 78753 | $1,234 | $335,021 |
| 78729 | $1,312 | $428,426 |
| 78728 | $1,287 | $402,184 |
A mortgage on the citywide median of $567,739 — assuming 20% down, a 30-year fixed loan at 7% — runs about $3,020/month in principal and interest alone. Add property taxes and insurance, and you’re looking at roughly $3,800-$4,000/month.
Compare that to rents of $1,200-$1,900 in most ZIP codes.
The gap is stark. Buying builds equity, and prices could recover. But right now, renters are paying significantly less per month. In 78753, rent is $1,234 — less than a third of what buying the median Austin home would cost monthly.
Population Growth and Migration
Austin’s population reached 993,588 in 2024. The city grew 2.9% from 2020 to 2024, adding roughly 27,700 residents over four years.
| Year | Population |
|---|---|
| 2020 | 965,893 |
| 2021 | 969,940 |
| 2022 | 979,214 |
| 2023 | 989,583 |
| 2024 | 993,588 |
Growth has been positive every year, though the pace appears to be slowing. The jump from 2022 to 2023 added about 10,400 people. From 2023 to 2024, only about 4,000.
How does Austin compare to other Texas cities?
| City | 2024 Population | 4-Year Growth |
|---|---|---|
| Houston | 2,390,125 | 4.0% |
| San Antonio | 1,526,656 | 6.1% |
| Fort Worth | 1,008,106 | 9.1% |
| Austin | 993,588 | 2.9% |
| Arlington | 403,672 | 2.4% |
| Lubbock | 272,086 | 5.4% |
Austin’s 2.9% growth rate is actually the second-slowest on this list. Fort Worth grew at 9.1%, San Antonio at 6.1%. Even Lubbock outpaced Austin at 5.4%.
The population is still rising, which supports long-term housing demand. But the slowdown in growth could be one factor behind softening prices. Fewer new arrivals means less competition for homes.
Austin Housing Market Trends
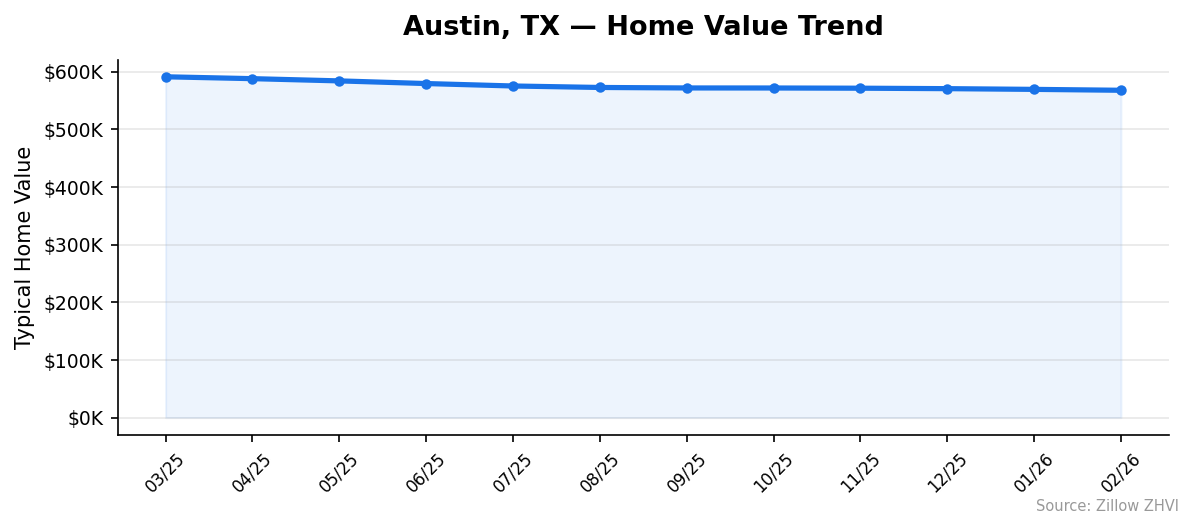
Here’s the full 12-month picture from March 2025 through February 2026:
| Month | Median Home Value | Monthly Change |
|---|---|---|
| March 2025 | $591,133 | — |
| April 2025 | $587,890 | -$3,243 |
| May 2025 | $584,014 | -$3,876 |
| June 2025 | $579,407 | -$4,607 |
| July 2025 | $575,179 | -$4,228 |
| August 2025 | $572,613 | -$2,566 |
| September 2025 | $571,761 | -$852 |
| October 2025 | $571,688 | -$73 |
| November 2025 | $571,334 | -$354 |
| December 2025 | $570,553 | -$781 |
| January 2026 | $569,297 | -$1,256 |
| February 2026 | $567,739 | -$1,558 |
The decline happened in two phases. From March through July 2025, prices dropped sharply — losing $3,000-$4,600 per month. Then from August through October, the slide nearly stopped. October barely moved at all, down just $73.
But the decline hasn’t ended. Since October, the pace has been picking up again. February’s drop of $1,558 was the largest since August.
Over the full year, Austin lost $23,394 in median home value. That’s a 4.0% decline — meaningful, but not a crash.
Is Austin a Good Place to Buy in 2026?
The data points in one direction: this is a buyer’s market, and it’s getting more favorable.
Prices have declined for twelve straight months. The year-over-year drop of 4.0% gives you bargaining power that didn’t exist two years ago. If you buy at today’s median of $567,739, you’re paying $23,400 less than someone who bought in March 2025.
The rental math muddies things. With most rents between $1,200 and $1,900, and monthly ownership costs north of $3,800, you need to be confident you’ll hold the property long enough for equity gains to offset the monthly premium.
Population growth remains positive at 2.9% over four years. Austin still draws residents, even if the pace has slowed. That’s a floor under long-term demand.
For buyers with a 5-year or longer horizon, falling prices and a growing population are a strong combination. For short-term buyers, the trend line says prices haven’t bottomed yet.
Austin Housing Market Outlook for 2026-2027
The 12-month trend shows a consistent decline with no reversal signal. Prices fell every month from March 2025 through February 2026.
The pace did slow significantly in the fall — September through November saw drops under $1,000/month. But the last two months have accelerated again, with February’s $1,558 decline nearly doubling November’s $354.
If the current pace continues, Austin’s median could slip below $560,000 by mid-2026. The three-month trend (December through February) shows an average decline of about $1,200/month.
Nothing in this data suggests a sharp reversal. The decline has been orderly — no cliff, no sudden drop. That pattern tends to continue until an external force changes it, such as a shift in mortgage rates or a surge in job growth.
Buyers should expect prices to continue softening through at least the first half of 2026. Whether the second half brings stabilization depends on factors outside this dataset.
Frequently Asked Questions
What is the average home price in Austin?
The average home price in Austin is $567,739 as of February 2026. This figure represents the Zillow Home Value Index across 39 tracked ZIP codes in the city. Prices range from $276,222 in the most affordable ZIP to $1,276,424 in the most expensive.
Are home prices going up or down in Austin?
Down. Austin home prices have fallen 4.0% year over year, declining every month for the past twelve. The median dropped from $591,133 in March 2025 to $567,739 in February 2026 — a loss of $23,394.
Is it cheaper to rent or buy in Austin?
Renting is substantially cheaper on a monthly basis. Typical rents in most Austin ZIP codes range from $1,234 to $1,900. A mortgage on the median home — with 20% down at 7% — costs roughly $3,020/month in principal and interest, before taxes and insurance. You’d need to hold the home for several years to close that gap through equity.
What is the most affordable neighborhood in Austin?
ZIP code 78725 has the lowest typical home value at $276,222. Other affordable options include 78724 ($319,450), 78741 ($329,033), and 78744 ($330,421). These eastern and southeastern ZIP codes all come in well below the citywide median of $567,739.
Methodology
Home values are based on the Zillow Home Value Index (ZHVI), a smoothed measure of typical home values in the 35th to 65th percentile range. Rent estimates use the Zillow Observed Rent Index (ZORI). Population figures come from the U.S. Census Bureau Population Estimates Program (2020-2024 vintage). All datasets are publicly available. Housing data updated 2026-02-28.