Average Home Price in Charlotte NC (2026): Trends & Data
$517,602. That’s what a typical home costs in Charlotte, NC right now. Prices are up 0.7% from a year ago — barely keeping pace with inflation. For a city adding thousands of new residents each year, that flat growth might surprise you.
Quick answer: The average home price in Charlotte, NC is $517,602 as of February 2026, up 0.7% year over year according to Zillow.
Current Home Prices in Charlotte
The Charlotte-Concord-Gastonia metro area spans 23 ZIP codes with a wide range of home values. Here’s where things stand as of February 2026:
| Metric | Value |
|---|---|
| Median home value | $517,602 |
| Year-over-year change | +0.7% |
| Lowest ZIP code value | $296,632 |
| Highest ZIP code value | $1,580,888 |
| Number of ZIP codes tracked | 23 |
That 0.7% annual gain works out to roughly $3,600 in equity over twelve months. Not nothing, but not the double-digit appreciation Charlotte saw earlier this decade.
The gap between the cheapest and most expensive neighborhoods tells a bigger story. The priciest ZIP code (28207) is worth more than five times the most affordable one (28208). Charlotte is not one market — it’s several, stacked on top of each other.
If you’re shopping below the metro median, you still have options in the low $300K range. If you’re looking at the south side or the established neighborhoods closer to uptown, expect to pay $600K or more.
Charlotte Home Prices by Neighborhood
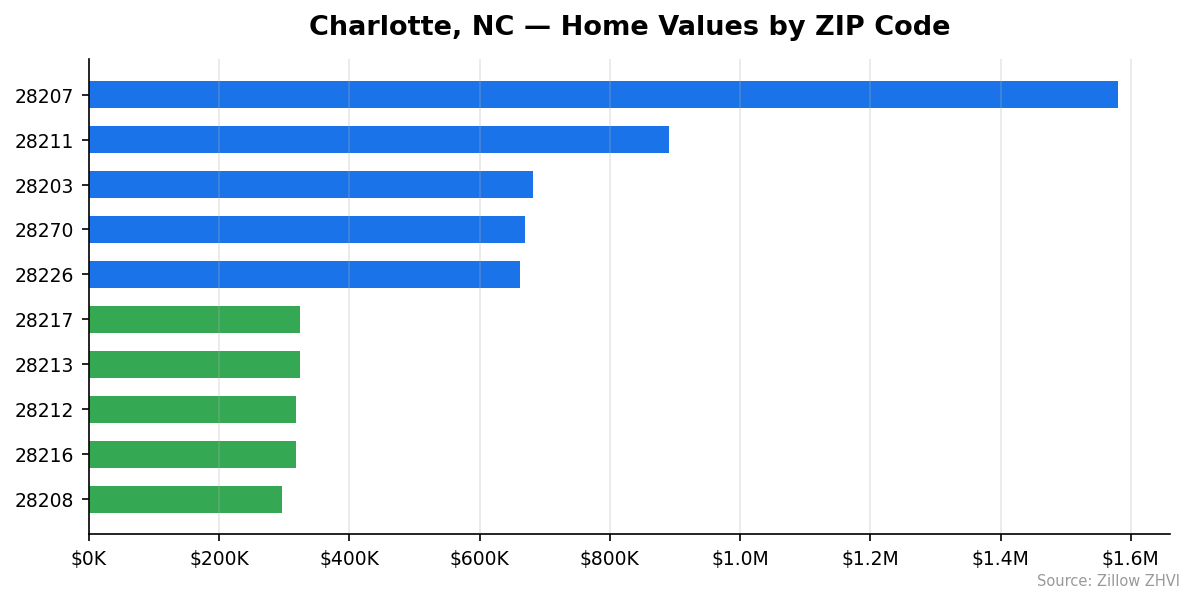
Not all Charlotte ZIP codes are priced alike. Here are all 23, sorted from most to least expensive:
| ZIP Code | Typical Home Value | Typical Monthly Rent |
|---|---|---|
| 28207 | $1,580,888 | $2,789 |
| 28211 | $890,968 | $1,913 |
| 28203 | $681,295 | $1,946 |
| 28270 | $669,022 | $1,537 |
| 28226 | $661,647 | $1,523 |
| 28209 | $649,905 | $1,603 |
| 28277 | $606,512 | $1,942 |
| 28204 | $580,353 | $1,668 |
| 28210 | $555,767 | $1,347 |
| 28278 | $497,185 | $1,805 |
| 28205 | $456,788 | $1,726 |
| 28202 | $418,729 | $1,896 |
| 28273 | $368,358 | $1,558 |
| 28269 | $357,912 | $1,726 |
| 28215 | $347,051 | $1,967 |
| 28262 | $343,389 | $1,549 |
| 28214 | $333,394 | $1,985 |
| 28206 | $324,305 | $1,574 |
| 28217 | $324,304 | $1,661 |
| 28213 | $324,142 | $1,575 |
| 28216 | $318,051 | $1,765 |
| 28212 | $318,227 | $1,375 |
| 28208 | $296,632 | $1,634 |
28207 is in a league of its own at $1.58M — that’s the Myers Park and Eastover area. The next tier down (28211, 28203, 28270) clusters around $670K-$891K, covering SouthPark and parts of uptown.
Your best deals are on the east and west sides. ZIP codes 28208, 28212, and 28216 all come in under $320K. That’s 40% below the metro median.
One odd pattern: rent doesn’t track home values very well. ZIP 28214 has a typical home value of just $333,394 but rent runs $1,985/mo — higher than some neighborhoods with homes worth twice as much. If you’re an investor, the rent-to-price ratio matters more than either number alone.
Rent vs Buy in Charlotte
Here’s the rough math. Take the median Charlotte home at $517,602. Put 20% down ($103,520) and finance the rest at 7%. Your monthly principal and interest payment comes to about $2,754.
Now add property taxes and insurance — conservatively another $400-$500/mo — and you’re looking at $3,150-$3,250 out the door each month.
Renting? Typical rents across Charlotte’s ZIP codes range from $1,347 (in 28210) to $2,789 (in 28207). Most neighborhoods fall between $1,550 and $1,950.
| Monthly Cost | |
|---|---|
| Mortgage (P&I on median home, 20% down, 7%) | ~$2,754 |
| Estimated taxes + insurance | ~$450 |
| Total ownership cost | ~$3,200 |
| Typical rent range | $1,347 – $2,789 |
| Midrange rent | ~$1,700 |
Buying costs roughly $1,500/mo more than renting a similar home. That gap has kept many would-be buyers on the sidelines.
The counterargument: you’re building equity. At 0.7% annual appreciation, a $517K home gains about $3,600/year in value. That doesn’t close the monthly gap, but over a 10-year hold, the math shifts. Buying makes more sense the longer you plan to stay.
Population Growth and Migration
Charlotte added 68,528 residents between 2020 and 2024. That’s a 7.8% growth rate in four years.
| Year | Population |
|---|---|
| 2020 | 874,948 |
| 2021 | 882,341 |
| 2022 | 898,699 |
| 2023 | 920,053 |
| 2024 | 943,476 |
Growth accelerated after 2021. The city added about 7,400 people that first year, then jumped to 16,000+ annually from 2022 onward. That’s a town’s worth of new residents every twelve months.
How does Charlotte compare to other NC cities?
| City | 2024 Population | 4-Year Growth |
|---|---|---|
| Wilmington | 125,284 | 8.1% |
| Charlotte | 943,476 | 7.8% |
| Raleigh | 499,825 | 7.3% |
| Durham | 301,870 | 7.2% |
| Concord | 112,395 | 7.1% |
| Greenville | 95,138 | 4.6% |
Wilmington edged Charlotte out on growth rate, but Charlotte added far more people in absolute terms. Nearly 70,000 new residents need housing. That sustained demand is one reason prices haven’t dropped despite higher mortgage rates.
More people means more competition for a limited housing stock, and that puts a floor under home values.
Charlotte Housing Market Trends
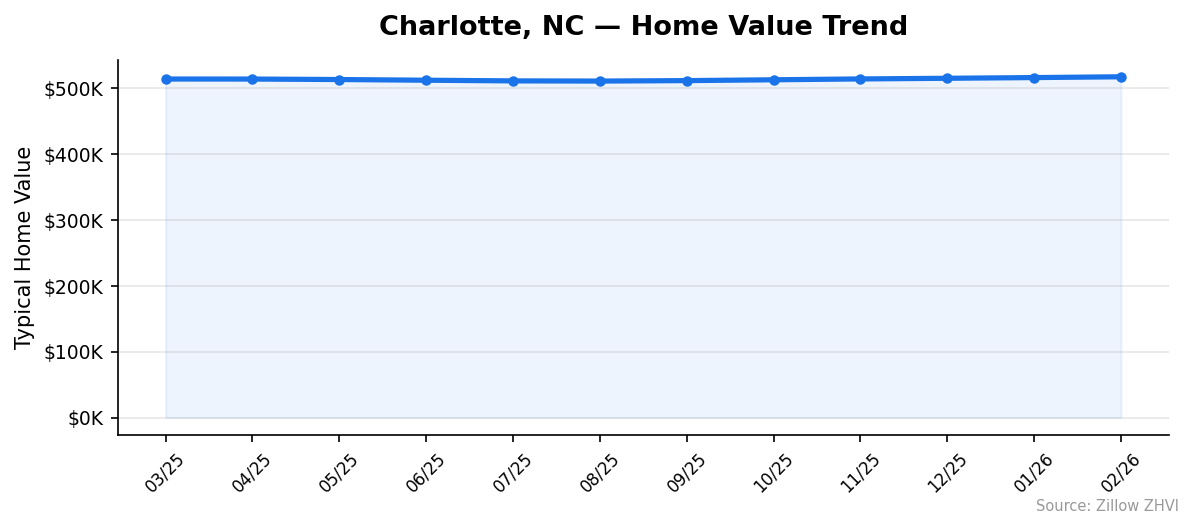
Here’s how the average home price in Charlotte moved month by month over the past year:
| Month | Avg. Home Value | Min | Max |
|---|---|---|---|
| Mar 2025 | $514,208 | $304,790 | $1,498,595 |
| Apr 2025 | $514,160 | $302,428 | $1,507,732 |
| May 2025 | $513,433 | $300,164 | $1,513,504 |
| Jun 2025 | $512,380 | $298,506 | $1,515,563 |
| Jul 2025 | $511,380 | $297,371 | $1,516,640 |
| Aug 2025 | $511,095 | $296,732 | $1,519,342 |
| Sep 2025 | $511,796 | $296,505 | $1,526,270 |
| Oct 2025 | $513,055 | $296,199 | $1,536,482 |
| Nov 2025 | $514,348 | $295,987 | $1,547,251 |
| Dec 2025 | $515,333 | $295,770 | $1,557,647 |
| Jan 2026 | $516,405 | $296,155 | $1,569,028 |
| Feb 2026 | $517,601 | $296,632 | $1,580,888 |
The pattern is clear: a dip through spring and summer 2025, bottoming out at $511,095 in August, followed by six straight months of gains.
Two things stand out. First, the floor (minimum ZIP value) barely moved all year — it stayed within a tight $296K-$305K band. The affordable end of Charlotte’s market is stable.
Second, the ceiling keeps rising. The most expensive ZIP went from $1.50M in March 2025 to $1.58M in February 2026 — a $82K gain. The high end is pulling away from the rest of the market.
Is Charlotte a Good Place to Buy in 2026?
The numbers paint a mixed picture.
On the positive side: prices are rising slowly. A 0.7% annual gain means you’re not overpaying into a frenzy. Population growth is strong, which supports long-term demand. And the entry-level market around $300K still exists — you don’t need $500K to own a home here.
On the other hand: mortgage rates near 7% make monthly payments steep. The rent-vs-buy gap is wide. And 0.7% appreciation barely beats a savings account.
If you plan to stay five years or more, buying at today’s prices is reasonable. Charlotte’s population isn’t slowing down, and housing supply in a growing city tends to tighten over time. If you’re thinking two to three years, renting gives you more flexibility at lower cost.
The strongest buying opportunity is in the $296K-$350K ZIP codes on the east and west sides. These areas offer the lowest entry point and, in some cases, above-average rents — useful if you ever need to convert your home to a rental.
Charlotte Housing Market Outlook for 2026-2027
The last six months show steady upward momentum. Prices have climbed from $511,095 in August 2025 to $517,601 in February 2026 — a gain of about $1,100 per month.
If the current pace continues, Charlotte’s median home value could reach the low $520Ks by mid-2026. That’s not a bold prediction — it’s simple trend extension.
The 3-month trend (December to February) shows accelerating gains: $515,333 → $516,405 → $517,601. Each month added slightly more than the last.
What could change the trajectory? A meaningful drop in mortgage rates would likely push prices higher and faster. A recession or major employer pullback would do the opposite. Neither scenario is visible in the current data.
For now, expect more of the same: slow, steady gains in the 0.5%-1.0% annual range. Charlotte isn’t booming, but it isn’t cooling off either.
Frequently Asked Questions
What is the average home price in Charlotte?
The average home price in Charlotte, NC is $517,602 as of February 2026. This figure represents the typical home value across 23 ZIP codes in the Charlotte metro area. Prices range from $296,632 in the most affordable ZIP to $1,580,888 in the most expensive.
Are home prices going up or down in Charlotte?
Home prices in Charlotte are going up. The year-over-year increase is 0.7% as of February 2026. Prices bottomed out in August 2025 at $511,095 and have risen for six consecutive months since then.
Is it cheaper to rent or buy in Charlotte?
Renting is cheaper on a monthly basis. Typical rents across Charlotte range from $1,347 to $2,789 per month, with most neighborhoods around $1,700. A mortgage on the median-priced home ($517,602) with 20% down at 7% runs about $3,200/mo including taxes and insurance — nearly double the typical rent.
What is the most affordable neighborhood in Charlotte?
ZIP code 28208 is the most affordable area in Charlotte with a typical home value of $296,632. Other affordable options include 28216 ($318,051), 28212 ($318,227), and 28213 ($324,142). All four are well below the metro median of $517,602.
Methodology
Home values are based on the Zillow Home Value Index (ZHVI), a smoothed measure of typical home values in the 35th to 65th percentile range. Rent estimates use the Zillow Observed Rent Index (ZORI). Population figures come from the U.S. Census Bureau Population Estimates Program (2020-2024 vintage). All datasets are publicly available. Housing data updated 2026-02-28.