Nampa Home Prices: $407K, Up 0.2% — 3 ZIPs Analyzed (2026)
$407,227. That’s what a typical home costs in Nampa right now. A year ago, it was almost the same — up just 0.2%. After a wild ride in Idaho’s housing market, Nampa has hit a plateau.
Quick answer: The average home price in Nampa, ID is $407,227 as of February 2026, up 0.2% year over year according to Zillow.
Current Home Prices in Nampa
Here’s a snapshot of where the Nampa market stands:
| Metric | Value |
|---|---|
| Median Home Price | $407,227 |
| Year-over-Year Change | +0.2% |
| Lowest ZIP Median | $372,075 |
| Highest ZIP Median | $425,069 |
| ZIP Codes Tracked | 3 |
| Data As Of | February 2026 |
A 0.2% annual gain is essentially flat. Adjusted for inflation, Nampa homeowners likely lost purchasing power over the past year. That said, the raw number still sits above $400K — a threshold Nampa crossed and hasn’t fallen back below.
The spread between the cheapest and most expensive ZIP codes is about $53,000. That’s a relatively tight range for a city of this size, meaning you won’t find dramatic price differences from one side of town to the other.
For buyers, this flatness is an opening. You’re not chasing a runaway market. For sellers, the days of automatic equity gains are over. Pricing has to be sharp.
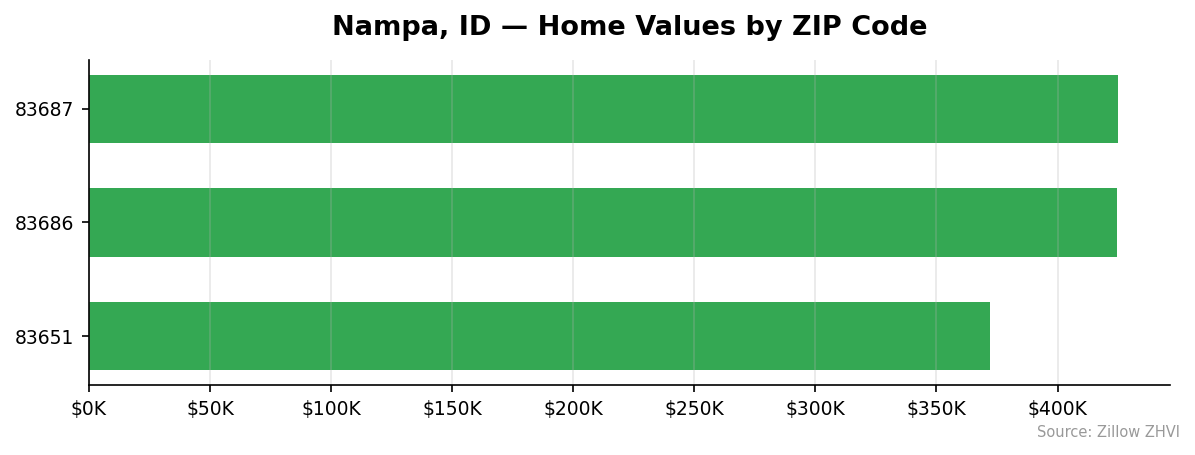
Nampa Home Prices by Neighborhood
All three tracked ZIP codes in Nampa show distinct price points:
| ZIP Code | Median Home Price | Median Rent |
|---|---|---|
| 83687 | $425,069 | $1,642/mo |
| 83686 | $424,535 | $1,547/mo |
| 83651 | $372,075 | $1,491/mo |
Most Expensive
83687 tops the list at $425,069, sitting 4.4% above the city median with the highest rents in Nampa at $1,642 per month. 83686 is nearly identical at $424,535 — just $534 less — but rents run about $95 cheaper per month, making it a slightly better value for investors.
Most Affordable
83651 is your entry point at $372,075, a full 8.6% below the city average. Rents here are the lowest too at $1,491 per month. If you’re looking for the most affordable way into the Nampa market, this is the ZIP to watch.
Rent vs Buy in Nampa
The rent-versus-buy math in Nampa leans toward renting — at least on a pure monthly cost basis.
| ZIP Code | Monthly Rent | Est. Mortgage (6.5%, 20% down) |
|---|---|---|
| 83687 | $1,642 | ~$2,150 |
| 83686 | $1,547 | ~$2,147 |
| 83651 | $1,491 | ~$1,882 |
These mortgage estimates assume a 20% down payment at 6.5% interest on a 30-year fixed loan. They don’t include property taxes, insurance, or maintenance — costs that push the true monthly expense of owning even higher.
The gap is roughly $400–$600 per month depending on the neighborhood. That’s real money. In 83651, the spread narrows to about $391, which is more manageable.
If you can handle the higher monthly payment and plan to stay five-plus years, buying locks in your housing cost. Rents in Nampa have been rising. But if you need flexibility or don’t have a down payment saved, renting keeps more cash in your pocket each month.
With prices essentially flat year over year, there’s no urgency to buy before values “get away from you.” Take your time.
Population Growth and Migration
Nampa is one of the fastest-growing cities in Idaho. The population jumped from 101,430 in 2020 to 117,350 in 2024 — a 15.7% increase in just four years.
| Year | Population |
|---|---|
| 2020 | 101,430 |
| 2021 | 106,617 |
| 2022 | 111,229 |
| 2023 | 114,825 |
| 2024 | 117,350 |
Growth has been consistent, adding roughly 4,000 residents per year. That pace slowed slightly in 2023 and 2024 compared to the 2021 surge, but Nampa is still firmly gaining.
How does Nampa compare to other Idaho cities?
| City | 2024 Population | 4-Year Growth |
|---|---|---|
| Meridian | 139,740 | +16.9% |
| Nampa | 117,350 | +15.7% |
| Caldwell | 73,088 | +20.3% |
| Idaho Falls | 69,523 | +5.5% |
| Twin Falls | 55,589 | +6.7% |
| Coeur d’Alene | 57,355 | +4.4% |
Caldwell leads the pack at 20.3% growth, but it’s a much smaller city. Among larger Idaho cities, Nampa and Meridian are growing at nearly the same rate. This population pressure supports housing demand — 15,920 new residents need somewhere to live.
Nampa Housing Market Trends
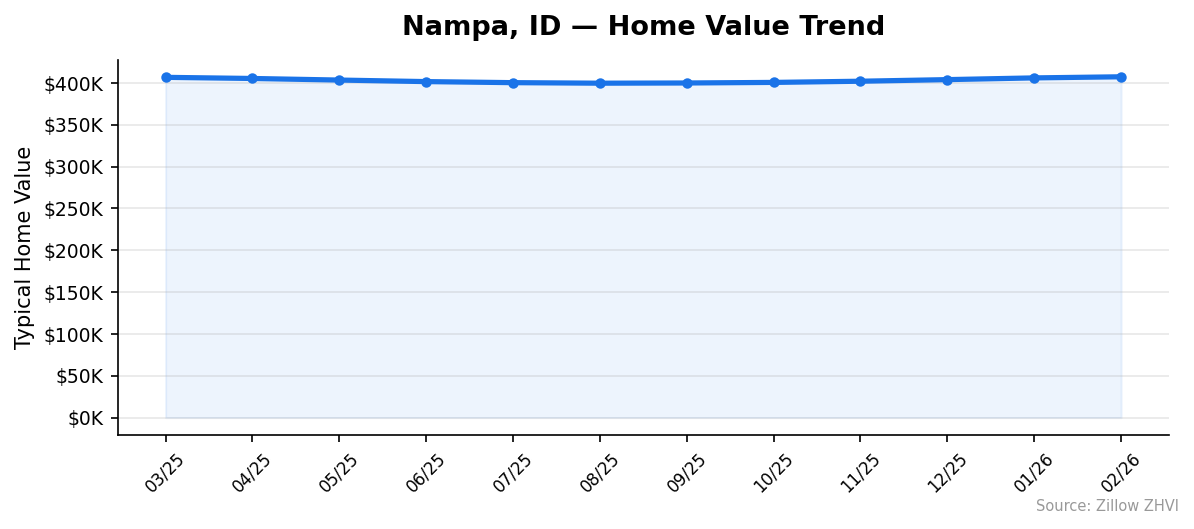
The 12-month price trend reveals a U-shaped pattern:
| Month | Average Price | Low | High |
|---|---|---|---|
| Feb 2026 | $407,227 | $372,075 | $425,069 |
| Jan 2026 | $405,910 | $370,990 | $423,593 |
| Dec 2025 | $403,845 | $369,388 | $421,387 |
| Nov 2025 | $401,929 | $368,061 | $419,173 |
| Oct 2025 | $400,511 | $367,287 | $417,431 |
| Sep 2025 | $399,820 | $367,100 | $416,495 |
| Aug 2025 | $399,576 | $367,288 | $416,041 |
| Jul 2025 | $400,217 | $368,205 | $416,462 |
| Jun 2025 | $401,478 | $369,609 | $417,454 |
| May 2025 | $403,320 | $371,527 | $419,493 |
| Apr 2025 | $405,214 | $373,518 | $421,640 |
| Mar 2025 | $406,573 | $375,114 | $423,134 |
Prices started at $406,573 in March 2025, then slid for six straight months to a low of $399,576 in August. Since then, they’ve climbed back every single month, regaining all lost ground and pushing slightly above last spring’s levels.
The August trough to February peak represents a $7,651 gain — a 1.9% recovery in six months. The recent trajectory is upward but modest.
Is Nampa a Good Place to Buy in 2026?
The data points to a balanced market. Prices aren’t falling, but they’re not surging either. A 0.2% annual gain barely registers.
That’s actually good news if you’re a buyer. You’re not competing in a frenzy. You have room to negotiate. And with three ZIP codes spanning a $53,000 range, there’s space to pick a price point that fits your budget.
The population story matters here. Nearly 16,000 new residents in four years creates steady demand for housing. That floor of demand makes a price collapse unlikely, even if gains stay small.
If you’re a seller, manage expectations. The market won’t hand you a windfall. Price competitively based on comparable sales, not what your neighbor’s home sold for two years ago.
Nampa Housing Market Outlook for 2026-2027
The three-month trend from December through February shows prices gaining about $1,100 per month. If that pace continues through 2026, you’d see Nampa medians push toward $415K–$420K by year-end.
But there’s a ceiling to watch. Prices peaked in spring 2025, dipped through summer, then recovered. The same seasonal pattern could repeat — a spring bump followed by a summer softening.
The more reliable signal is the year-over-year number: 0.2%. Nampa appears settled into a low single-digit growth environment. Expect 1%–3% annual appreciation unless mortgage rates shift dramatically or population growth accelerates further.
No data here suggests a sharp move in either direction.
Similar Markets in ID
If you’re exploring Idaho’s housing market beyond Nampa, consider these:
- Boise — The state capital and Nampa’s neighbor in the Boise metro. Expect higher prices but more inventory and amenities.
- Idaho Falls — Eastern Idaho’s largest city with slower population growth at 5.5%, which could mean less competition for buyers.
Frequently Asked Questions
What is the average home price in Nampa?
The average home price in Nampa is $407,227 as of February 2026. That figure represents the typical home value across three tracked ZIP codes, ranging from $372,075 in 83651 to $425,069 in 83687.
Are home prices going up or down in Nampa?
Prices are up, but barely — just 0.2% year over year. The monthly trend shows a dip through mid-2025 followed by a steady recovery. Since August 2025, prices have increased every month.
Is it cheaper to rent or buy in Nampa?
Renting is cheaper on a monthly basis. The median rent across Nampa is roughly $1,491 to $1,642 depending on the ZIP code. A mortgage on the median-priced home at 6.5% with 20% down runs about $2,060 before taxes and insurance — a gap of $400 to $600 per month.
What is the most affordable neighborhood in Nampa?
ZIP code 83651 has the lowest home values at $372,075, which is 8.6% below the city median. Rents are also the lowest in this ZIP at $1,491 per month, making it the most affordable area in Nampa for both buyers and renters.
Methodology
Home values are based on the Zillow Home Value Index (ZHVI), a smoothed measure of typical home values in the 35th to 65th percentile range. Rent estimates use the Zillow Observed Rent Index (ZORI). Population figures come from the U.S. Census Bureau Population Estimates Program (2020-2024 vintage). All datasets are publicly available. Housing data updated 2026-02-28.