Average Home Price in Nashville TN (2026): Trends & Data
$538K. That’s what a typical home costs in Nashville right now — and for the first time in years, that number is heading in the wrong direction for sellers.
The median home value in Nashville sits at $537,998 as of February 2026, down 1.0% from a year ago. The decline is small, but it marks a shift. After a decade of relentless price growth, the Nashville market is cooling.
Quick answer: The average home price in Nashville, TN is $537,998 as of February 2026, down 1.0% year over year according to Zillow.
Current Home Prices in Nashville
Here’s a snapshot of where the Nashville housing market stands today.
| Metric | Value |
|---|---|
| Median home value | $537,998 |
| Year-over-year change | -1.0% |
| Lowest ZIP code value | $322,465 |
| Highest ZIP code value | $1,174,270 |
| Number of ZIP codes tracked | 25 |
| Data as of | February 2026 |
The spread between Nashville’s cheapest and most expensive neighborhoods tells you a lot. A home in the priciest ZIP costs more than 3.6 times what you’d pay in the most affordable one. That $851K gap means “Nashville home prices” is almost meaningless without context — where in Nashville matters enormously.
The 1.0% year-over-year drop translates to roughly $5,600 less than a year ago. That’s not a crash. It’s a market finding its ceiling. Prices rose so fast between 2020 and 2024 that this correction was overdue. If you bought in 2020, you’re still sitting on significant equity. If you’re buying now, you have slightly more breathing room than buyers did 12 months ago.
One thing the headline number hides: the decline hasn’t been uniform. The lower end of the market has actually fallen faster than the top. The cheapest ZIP dropped from $332,203 to $322,465 over 12 months — a 2.9% decline. The most expensive ZIP rose from $1,152,216 to $1,174,270, a 1.9% gain. Wealth insulation is real.
Nashville Home Prices by Neighborhood
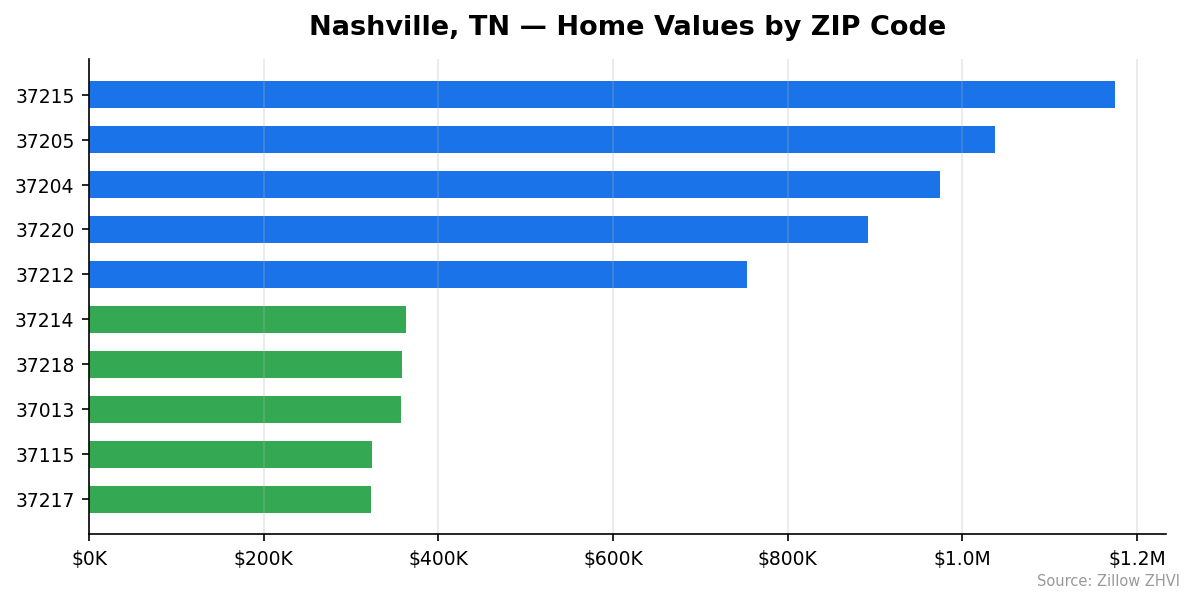
Nashville’s 25 tracked ZIP codes range from starter-home territory to seven-figure estates. Here are the ten most expensive and ten most affordable neighborhoods.
Most Expensive Neighborhoods
| ZIP Code | Typical Home Value |
|---|---|
| 37215 | $1,174,270 |
| 37205 | $1,036,816 |
| 37204 | $973,964 |
| 37220 | $891,694 |
| 37212 | $752,872 |
| 37203 | $624,644 |
| 37206 | $610,428 |
| 37209 | $547,661 |
| 37221 | $499,061 |
| 37201 | $498,789 |
Most Affordable Neighborhoods
| ZIP Code | Typical Home Value |
|---|---|
| 37217 | $322,465 |
| 37115 | $323,771 |
| 37013 | $357,070 |
| 37218 | $358,709 |
| 37214 | $362,825 |
| 37210 | $364,886 |
| 37207 | $369,652 |
| 37138 | $383,899 |
| 37211 | $393,375 |
| 37189 | $396,435 |
The 37215 ZIP code — which covers the Belle Meade and Green Hills area — is the only Nashville neighborhood where the typical home exceeds $1 million. Two ZIPs top $900K: 37205 and 37204.
On the affordable end, 37217 and 37115 are the only Nashville ZIPs where you can find a typical home under $325K. If you’re looking for something under $400K, you have ten ZIP codes to choose from. That’s 40% of tracked neighborhoods — a reasonable share, though those areas tend to sit farther from downtown.
The median Nashville home costs $538K, but more than half the ZIP codes tracked fall below that number. A handful of wealthy neighborhoods pull the average up.
Rent vs Buy in Nashville
Rent data is available for 22 Nashville ZIP codes. Here’s how the numbers compare across a selection of neighborhoods.
| ZIP Code | Home Value | Monthly Rent | Price-to-Rent Ratio |
|---|---|---|---|
| 37217 | $322,465 | $1,362 | 19.7 |
| 37115 | $323,771 | $1,580 | 17.1 |
| 37013 | $357,070 | $1,548 | 19.2 |
| 37207 | $369,652 | $1,881 | 16.4 |
| 37209 | $547,661 | $1,770 | 25.8 |
| 37206 | $610,428 | $1,969 | 25.8 |
| 37212 | $752,872 | $1,998 | 31.4 |
| 37205 | $1,036,816 | $2,069 | 41.8 |
| 37215 | $1,174,270 | $2,690 | 36.4 |
The price-to-rent ratio tells the story. A ratio under 20 generally favors buying. Over 25 favors renting. Over 30, renting wins by a wide margin.
In Nashville’s affordable neighborhoods — 37217, 37115, 37013 — the math leans toward buying if you plan to stay several years. But in expensive areas like 37205 and 37215, you’re paying over 35 times annual rent to own. Renting there makes more financial sense for most people.
A rough mortgage estimate: on a $538K home with 20% down, a 30-year loan at 7% runs about $2,864 per month in principal and interest alone. Add property taxes and insurance, and you’re likely above $3,400. Compare that to median rents in the $1,700–$2,000 range, and the monthly gap is significant. You need to factor in equity building and tax benefits to close it.
Nashville Housing Market Trends
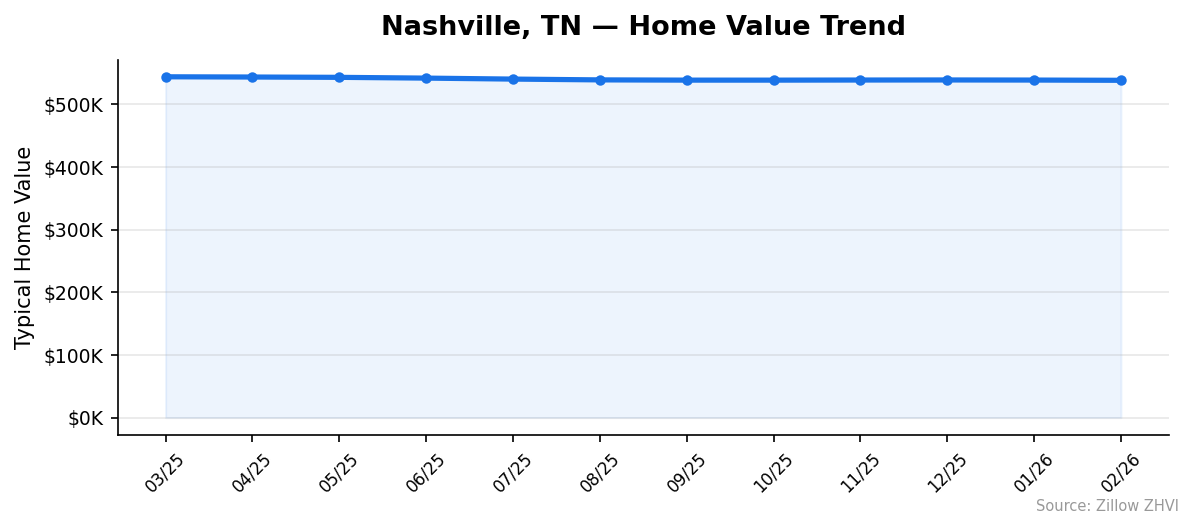
Here’s how Nashville home values moved month by month over the past year.
| Month | Median Home Value | Change from Prior Month |
|---|---|---|
| March 2025 | $543,608 | — |
| April 2025 | $543,233 | -$375 |
| May 2025 | $542,725 | -$508 |
| June 2025 | $541,493 | -$1,232 |
| July 2025 | $539,935 | -$1,558 |
| August 2025 | $538,666 | -$1,269 |
| September 2025 | $538,279 | -$387 |
| October 2025 | $538,263 | -$16 |
| November 2025 | $538,434 | +$171 |
| December 2025 | $538,543 | +$109 |
| January 2026 | $538,385 | -$158 |
| February 2026 | $537,998 | -$387 |
The trend breaks into two phases. From March through August 2025, prices dropped steadily — losing about $4,900 over six months. Then the market flatlined. September through December saw virtually no movement, with prices hovering in a narrow $280 band.
January and February 2026 brought a slight resumption of the decline. But “slight” is the key word. The $387 drop in February is a rounding error on a $538K home.
The total decline over 12 months: $5,611. That’s a 1.0% loss. To put it in perspective, a homeowner who bought at the March 2025 peak has lost about the cost of a used car. Not devastating, but a clear signal that the days of easy 10%+ annual gains are over.
Is Nashville a Good Place to Buy in 2026?
The data points to a balanced market tilting slightly toward buyers.
Prices are declining, but slowly. A 1.0% annual drop gives buyers modest bargaining power without signaling distress. You’re not catching a falling knife — you’re picking up a small discount.
The affordable end of the market (under $400K) offers 10 ZIP codes with reasonable price-to-rent ratios. If you’re buying in 37217, 37115, or 37013, the math works compared to renting. In expensive neighborhoods like 37215 or 37205, the numbers favor renters unless you’re in it for the long haul.
Mortgage rates remain the wild card. At 7%, monthly payments on a median-priced Nashville home run well above typical rents. If rates drop, affordability improves quickly. If they don’t, the price correction may continue.
For buyers who plan to stay five or more years and can target neighborhoods where the price-to-rent ratio is under 20, Nashville still makes sense. For short-term buyers or anyone eyeing the million-dollar neighborhoods, the risk-reward calculation is tighter.
Nashville Housing Market Outlook for 2026-2027
The 12-month trend suggests Nashville is in a slow drift downward, not a correction.
From March through August 2025, the decline was steady and measurable — about $800 per month on average. Then the market found a floor around $538K and sat there for four months. The recent February reading of $537,998 is the lowest in the dataset, but barely.
If the current pace continues — roughly $200 to $400 per month of decline — Nashville could end 2026 in the $535K to $537K range. That would put the total peak-to-trough decline at about 1.5% to 2%.
The three-month trend from December 2025 through February 2026 shows an average monthly decline of $182. That’s essentially flat. The market appears to be searching for a bottom rather than accelerating downward.
One pattern worth watching: the lower end of the market is falling faster than the upper end. The minimum ZIP value dropped from $332K to $322K over 12 months, while the maximum rose from $1.15M to $1.17M. If this divergence continues, affordable neighborhoods may offer better buying opportunities as 2026 progresses.
Frequently Asked Questions
What is the average home price in Nashville?
The average home price in Nashville is $537,998 as of February 2026. This figure represents the typical home value across 25 tracked ZIP codes, with individual neighborhoods ranging from $322,465 to $1,174,270.
Are home prices going up or down in Nashville?
Nashville home prices are down 1.0% year over year as of February 2026. The decline has been gradual — prices dropped steadily from March through August 2025, then largely flattened. The total loss over 12 months is about $5,600.
Is it cheaper to rent or buy in Nashville?
Renting is cheaper on a monthly basis in most Nashville neighborhoods. A mortgage on the median $538K home runs above $2,800 per month before taxes and insurance. Typical rents range from $1,362 to $2,690 depending on neighborhood. However, in affordable ZIPs like 37217 and 37115, the price-to-rent ratio drops below 20, making the buy decision more competitive.
What is the most affordable neighborhood in Nashville?
ZIP code 37217 has the lowest typical home value in Nashville at $322,465. The next most affordable is 37115 at $323,771. Both neighborhoods are priced about $215K below the city median, making them the most accessible entry points for buyers.
Methodology
Home values are based on the Zillow Home Value Index (ZHVI), a smoothed measure of typical home values in the 35th to 65th percentile range. Rent estimates use the Zillow Observed Rent Index (ZORI). All datasets are publicly available. Housing data updated 2026-02-28.