New Orleans Home Prices: $270K, Down 2.4% — 17 ZIPs Analyzed (2026)
$270,451. That’s the typical home value in New Orleans as of February 2026, down 2.4% from a year earlier. Prices have fallen for 12 consecutive months in this market.
Quick answer: The average home price in New Orleans, LA is $270,451 as of February 2026, down 2.4% year over year.
Current Home Prices in New Orleans
The numbers don’t lie. New Orleans home values sit well below the national median, and they keep slipping. Here’s what buyers and sellers are working with right now.
| Metric | Value |
|---|---|
| Median home value | $270,451 |
| Year-over-year change | -2.4% |
| Cheapest ZIP | $143,217 (70129) |
| Most expensive ZIP | $515,595 (70115) |
| Price spread | 3.6x between cheapest and priciest ZIP |
| ZIP codes analyzed | 17 |
| Data month | February 2026 |
The headline figure of $270K hides a wide gap. A home in the lowest-priced neighborhood costs less than a third of one in the priciest. That kind of spread is unusual for a mid-sized city and tells you New Orleans is really several housing markets stacked on top of each other.
The 2.4% annual drop is small but meaningful. It puts the city in a different category from much of the South, where prices climbed through 2025. The decline isn’t a one-month blip either. Every month of the past year has come in lower than the previous one.
You’re looking at a market where buyers have more bargaining room than they’ve had in years.
New Orleans Home Prices by Neighborhood
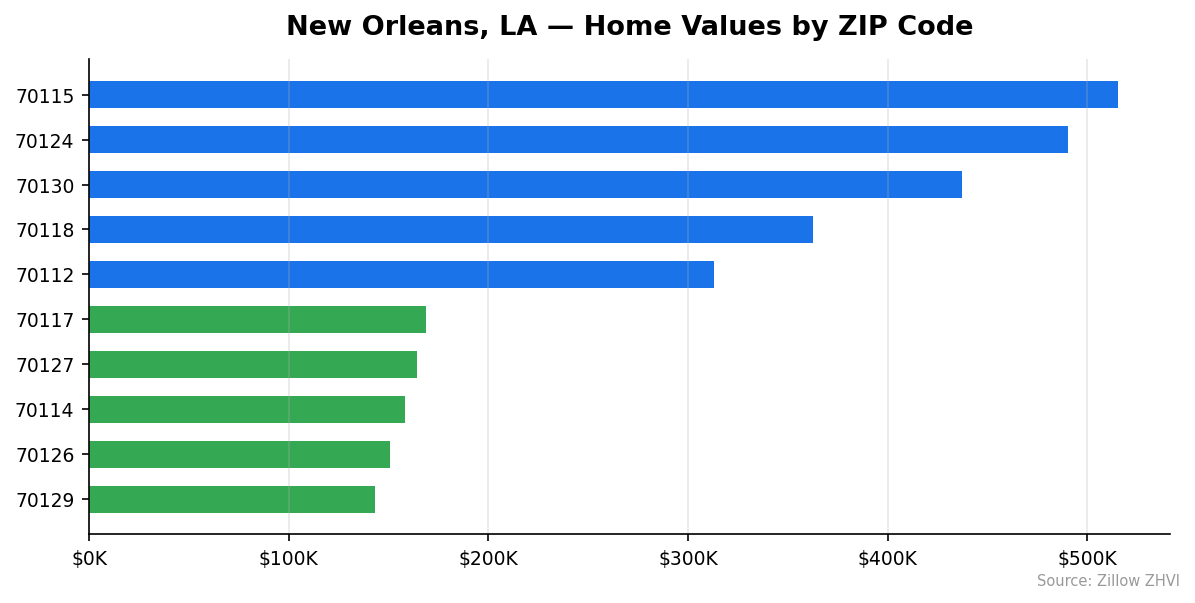
Seventeen ZIPs span the range from working-class East New Orleans to the Garden District. Here’s how they sort by typical home value.
| ZIP | Median Value | Typical Rent |
|---|---|---|
| 70115 | $515,595 | $1,704 |
| 70124 | $490,257 | $1,876 |
| 70130 | $437,097 | $1,789 |
| 70118 | $362,841 | $1,628 |
| 70112 | $312,822 | $1,842 |
| 70116 | $296,786 | $1,653 |
| 70125 | $288,647 | $1,702 |
| 70119 | $287,358 | $1,609 |
| 70113 | $226,660 | $1,445 |
| 70122 | $215,722 | $1,489 |
| 70131 | $206,930 | $1,401 |
| 70128 | $172,063 | n/a |
| 70117 | $168,630 | $1,404 |
| 70127 | $164,126 | $1,409 |
| 70114 | $158,436 | $1,432 |
| 70126 | $150,485 | $1,513 |
| 70129 | $143,217 | n/a |
Most Expensive
70115 tops the list at $515,595, nearly double the city median, covering the Uptown and Garden District corridor. 70124 follows at $490,257 in Lakeview, where rents also lead the city at $1,876. 70130 — the Lower Garden District and CBD — comes in at $437,097, with rents around $1,789.
Most Affordable
70129 sits at the bottom at $143,217, less than a third of the priciest ZIP. 70126 lands at $150,485, with rent of $1,513 — meaning the rent-to-price ratio is one of the most favorable for landlords in the city. 70114 on the West Bank closes out the bottom three at $158,436.
Rent vs Buy in New Orleans
Average rent across the 15 ZIPs with data: roughly $1,593 per month. The cheapest rent shows up in 70131 at $1,401. The priciest in 70124 at $1,876.
Now run the buying math. A $270,000 home with 20% down ($54,000) leaves a $216,000 mortgage. At a 7% rate over 30 years, principal and interest cost about $1,437 per month.
That’s only the start. Property taxes in Orleans Parish add roughly $125 per month for a typical home. Then there’s insurance — and this is where New Orleans gets expensive. Hurricane and flood coverage in this market runs $300 to $500 per month for many homes, more than triple what buyers in low-risk metros pay.
| Cost | Monthly |
|---|---|
| Average rent | $1,593 |
| Mortgage P&I | $1,437 |
| Property tax (estimate) | $125 |
| Insurance (estimate) | $350 |
| Total to own | ~$1,912 |
Renting saves about $300 per month over buying once you fold in carrying costs. That gap closes if home prices stop falling and start appreciating. With prices sliding 2.4% per year, current owners are losing roughly $6,500 in value annually on a typical home. That makes the renter math even better in the short run.
If you plan to stay seven-plus years and buy in a stable ZIP, the equity build-up still makes ownership worthwhile. Under five years, you’re probably better off renting.
Population Growth and Migration
New Orleans is losing people. Census estimates show 362,701 residents in 2024, down from 383,374 in 2020. That’s a 5.4% drop in four years.
| Year | Population |
|---|---|
| 2020 | 383,374 |
| 2021 | 377,547 |
| 2022 | 370,473 |
| 2023 | 365,167 |
| 2024 | 362,701 |
The decline has slowed but hasn’t stopped. The city lost about 5,800 people in 2021, then 7,100 in 2022, 5,300 in 2023, and 2,500 in 2024. The trajectory points toward stabilization, but no growth.
How does that compare to the rest of Louisiana? Most major cities are also losing residents.
| City | 2024 Population | 4-Year Growth |
|---|---|---|
| Baton Rouge | 220,907 | -2.4% |
| Lafayette | 122,280 | +0.7% |
| Lake Charles | 81,157 | -4.4% |
| Kenner | 64,650 | -2.5% |
| Bossier City | 63,218 | +0.8% |
| New Orleans | 362,701 | -5.4% |
Only Lafayette and Bossier City posted gains, and both were under 1%. New Orleans had the worst four-year contraction of any city on the comparison list.
That matters for housing demand. Fewer residents means less pressure on home prices and more options for buyers. It also helps explain the steady price decline — supply isn’t shrinking nearly as fast as the population.
New Orleans Housing Market Trends
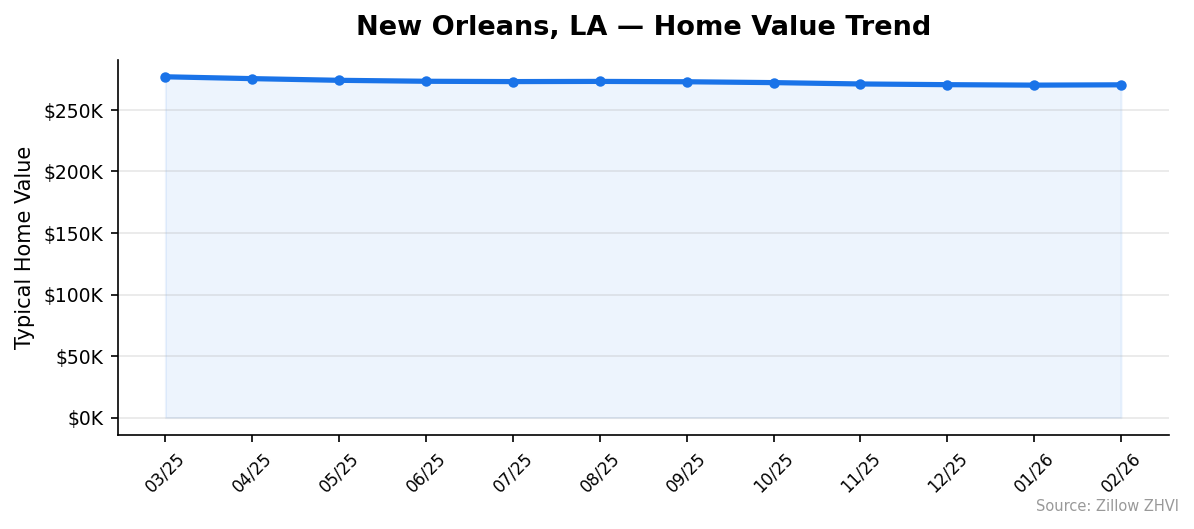
Twelve months of data, twelve months of declines. Here’s the trail.
| Month | Median Value |
|---|---|
| Feb 2026 | $270,451 |
| Jan 2026 | $270,196 |
| Dec 2025 | $270,570 |
| Nov 2025 | $271,149 |
| Oct 2025 | $272,242 |
| Sep 2025 | $272,943 |
| Aug 2025 | $273,220 |
| Jul 2025 | $273,078 |
| Jun 2025 | $273,333 |
| May 2025 | $274,112 |
| Apr 2025 | $275,476 |
| Mar 2025 | $276,975 |
The total drop over 12 months: $6,524, or 2.4%. The pace was steepest in the spring and summer of 2025, when prices fell roughly $700 to $1,500 per month. Things flattened in late 2025 and early 2026, with the market giving up only a few hundred dollars per month.
January 2026 actually ticked up slightly from December — the first month-over-month gain in the trend. February held that ground. Two months don’t make a recovery, but the steepest part of the slide appears to be over.
The minimum value (cheapest ZIP) followed a different pattern. It climbed from $138,992 in March 2025 to $143,217 in February 2026, a 3% gain. Affordable neighborhoods are firming up while pricier areas absorb the bigger losses.
Is New Orleans a Good Place to Buy in 2026?
The data points to a buyer’s market, not a seller’s. Prices have fallen for a year. Population is declining. Insurance costs are high. None of those favor sellers.
For buyers, that translates into more room to negotiate. Sellers who listed at 2024 peaks are now competing with neighbors who’ve cut prices. You can ask for closing-cost help, repairs, or rate buydowns and reasonably expect a yes.
The catch is insurance. Premiums in New Orleans have climbed sharply over the past three years, driven by hurricane losses and reinsurance costs. A monthly mortgage payment that looks affordable on paper can balloon once you add the actual cost of coverage. Get an insurance quote on any home before you make an offer, not after.
Affordable ZIPs like 70126, 70127, and 70114 offer entry points under $170K. That’s rare in a major US metro. Just check flood zones — much of low-elevation New Orleans requires federal flood insurance on top of standard hazard policies.
If you can absorb the carrying costs and plan to stay long enough to ride out the slow market, you’re shopping at a discount.
New Orleans Housing Market Outlook for 2026-2027
The 12-month trend tells you most of what you need to know. Prices have dropped 2.4% over the year, but the pace slowed sharply in the past three months — losing about $300 per month versus over $1,000 monthly during the spring 2025 stretch.
If the current pace continues, prices would land near $267K by mid-2026 and stay flat into 2027. The two-month uptick in January and February could mark a bottom, though one quarter of data isn’t enough to call it.
Population trends remain a headwind. As long as New Orleans loses residents faster than its peer cities, demand will stay soft. Insurance pressure adds another drag — homes that can’t be insured affordably are tougher to sell at any price.
The most likely scenario for the next six months is more of the same: small monthly moves, a flat-to-slightly-down median, and continued opportunity for patient buyers. A sharp recovery would need a population reversal that the Census data doesn’t yet show.
Similar Markets in LA
If New Orleans isn’t quite right, Louisiana has options at different price points and growth profiles.
- Baton Rouge — the state capital, larger than only New Orleans, with similar population decline.
- Metairie — the Jefferson Parish suburb just west of New Orleans, often cheaper insurance and steadier demand.
- Lafayette — one of only two Louisiana cities still gaining residents in 2024.
- Slidell — across Lake Pontchartrain, attracts commuters who want New Orleans access without the city tax base.
- Shreveport — north Louisiana market with very different pricing dynamics from the Gulf metros.
Frequently Asked Questions
What is the average home price in New Orleans?
The average home price in New Orleans is $270,451 as of February 2026. That value reflects the typical mid-tier home across 17 ZIP codes spanning Uptown, Mid-City, the West Bank, and East New Orleans. It sits well below the US median.
Are home prices going up or down in New Orleans?
Prices are down 2.4% year over year and have declined for 12 consecutive months. The drop was steepest in spring and summer 2025, then slowed to small monthly moves in early 2026. January and February ticked up slightly, hinting that the floor may be near.
Is it cheaper to rent or buy in New Orleans?
Renting saves about $300 per month right now. Average rent runs $1,593, while owning a $270K home costs roughly $1,912 per month once you add taxes and high hurricane insurance premiums. Buying makes more sense if you plan to stay seven or more years.
What is the most affordable neighborhood in New Orleans?
ZIP 70129 in eastern New Orleans has the lowest typical home value at $143,217. ZIP 70126 follows at $150,485, and 70114 on the West Bank rounds out the bottom three at $158,436. All three fall under $170K.
Methodology
Home values are based on the Zillow Home Value Index (ZHVI), a smoothed measure of typical home values in the 35th to 65th percentile range. Rent estimates use the Zillow Observed Rent Index (ZORI). Population figures come from the U.S. Census Bureau Population Estimates Program (2020-2024 vintage). All datasets are publicly available. Housing data updated 2026-02-28.