Average Home Price in New York NY (2026): Trends, Rents & Data
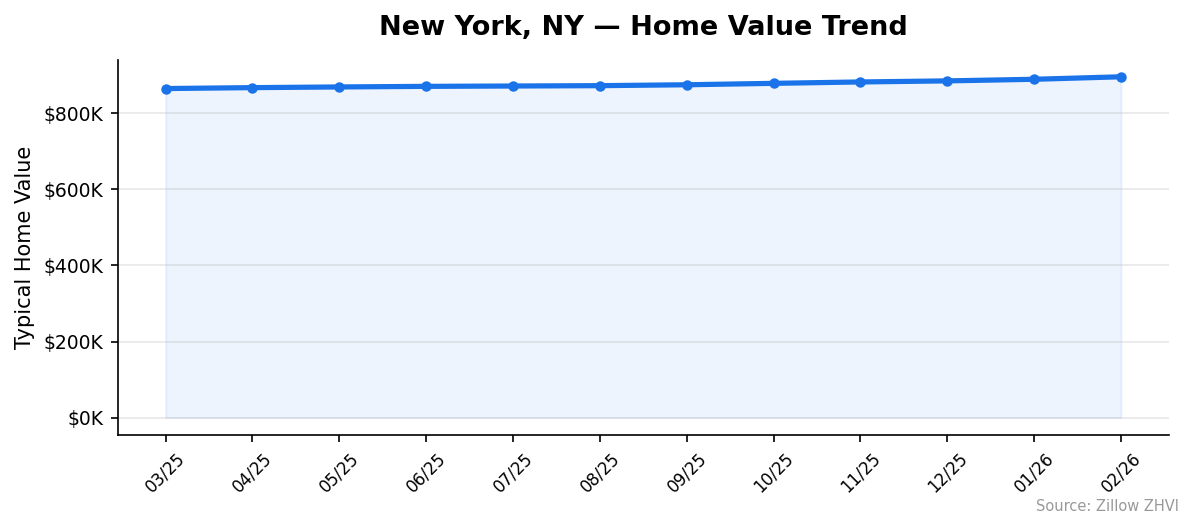
$896,056. That’s what a typical home costs in New York City as of February 2026. Prices are up 3.6% from a year ago, and the city has posted 12 straight months of gains. Whether you’re buying, renting, or just watching the market, here’s what the numbers say right now.
Quick answer: The average home price in New York, NY is $896,056 as of February 2026, up 3.6% year over year according to Zillow.
Current Home Prices in New York
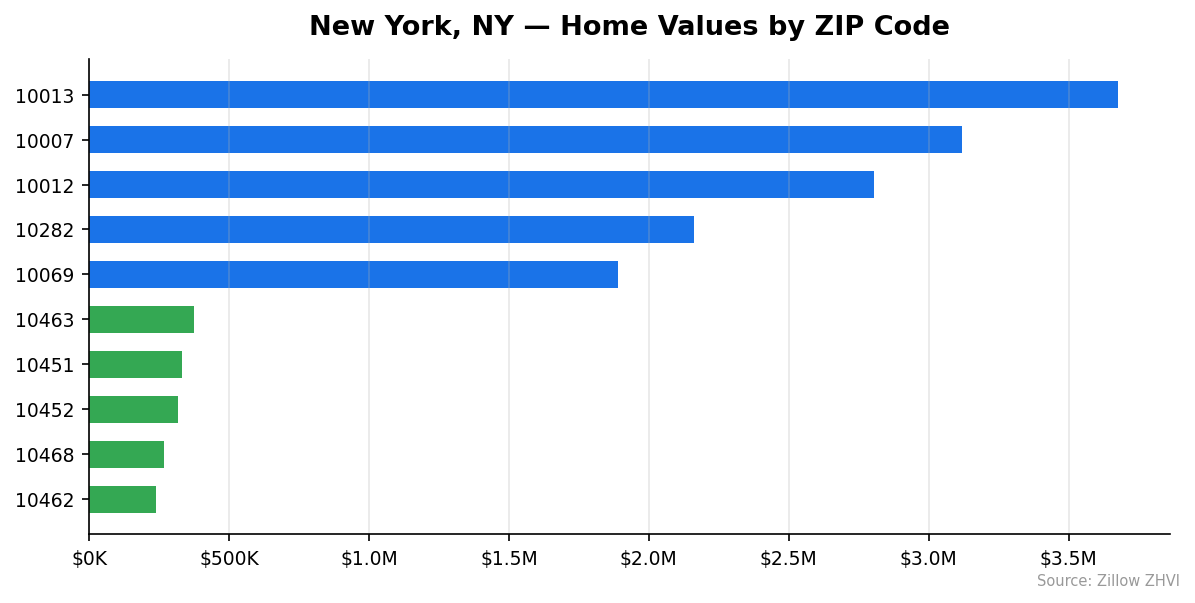
The citywide median sits just under $900K, but that single number hides enormous range. The cheapest ZIP code in the five boroughs has a typical home value of $238,668. The most expensive tops $3.6 million. That’s a 15x spread within the same city limits.
| Metric | Value |
|---|---|
| Median home value | $896,056 |
| Year-over-year change | +3.6% |
| Lowest ZIP value | $238,668 (10462) |
| Highest ZIP value | $3,677,140 (10013) |
| ZIP codes tracked | 172 |
| Data as of | February 2026 |
A 3.6% annual gain on a $896K home means roughly $32,000 in appreciation over the past year. That’s more than many Americans earn in a year — and it happened passively for homeowners.
The month-over-month trend tells a similar story. Values climbed from $889,486 in January to $896,056 in February, a $6,570 jump in a single month. Prices haven’t dipped once since at least March 2025.
One thing to keep in mind: the Zillow Home Value Index measures the “typical” home — the 35th to 65th percentile. Luxury properties and entry-level homes can diverge sharply from this figure.
New York Home Prices by Neighborhood
With 172 ZIP codes tracked, New York’s price map reads like a tale of five boroughs. Manhattan dominates the top of the list. The Bronx fills most of the bottom.
Most Expensive ZIP Codes
| ZIP | Neighborhood Area | Typical Home Value |
|---|---|---|
| 10013 | Tribeca / SoHo | $3,677,140 |
| 10007 | Financial District | $3,117,177 |
| 10012 | NoHo / SoHo | $2,804,187 |
| 10282 | Battery Park City | $2,160,426 |
| 10069 | Upper West Side | $1,891,107 |
| 10014 | West Village | $1,795,437 |
| 10001 | Chelsea | $1,723,058 |
| 11231 | Carroll Gardens (Brooklyn) | $1,687,360 |
| 10065 | Upper East Side | $1,670,766 |
| 10011 | Chelsea / West Village | $1,592,159 |
Tribeca’s 10013 is in a class of its own — more than 4x the citywide median. Brooklyn’s Carroll Gardens cracks the top 10, proof that Manhattan no longer holds a monopoly on seven-figure real estate.
Most Affordable ZIP Codes
| ZIP | Neighborhood Area | Typical Home Value |
|---|---|---|
| 10462 | Parkchester (Bronx) | $238,668 |
| 10468 | Fordham (Bronx) | $268,268 |
| 10452 | Highbridge (Bronx) | $319,081 |
| 10451 | Melrose (Bronx) | $331,929 |
| 10463 | Kingsbridge (Bronx) | $374,153 |
| 11415 | Kew Gardens Hills (Queens) | $375,081 |
| 10467 | Norwood (Bronx) | $419,871 |
| 11372 | Jackson Heights (Queens) | $424,051 |
| 10458 | Belmont (Bronx) | $424,337 |
| 11374 | Rego Park (Queens) | $426,368 |
You can buy a home in the Bronx for under $240K. That’s 73% below the citywide median and cheaper than many homes in mid-size American cities. The Bronx claims seven of the ten most affordable ZIPs in New York. Queens picks up the remaining three.
Rent vs Buy in New York
Rents in New York vary as wildly as home prices. The cheapest tracked ZIP (10309, southern Staten Island) averages $1,821 per month. The most expensive (10282, Battery Park City) averages $7,214.
Here’s how buying compares to renting across different price tiers:
| Area Type | Typical Home Value | Est. Mortgage Payment* | Typical Monthly Rent |
|---|---|---|---|
| Citywide median | $896,056 | ~$4,770 | $3,100–$3,500 |
| Affordable ZIP (10462, Bronx) | $238,668 | ~$1,270 | $2,542 |
| Mid-range ZIP (11385, Queens) | $865,571 | ~$4,610 | $3,089 |
| Expensive ZIP (10013, Tribeca) | $3,677,140 | ~$19,570 | $6,214 |
*Estimated monthly principal and interest on a 30-year fixed mortgage at 7%, with 20% down. Does not include property taxes, insurance, or maintenance.
A striking pattern emerges in affordable neighborhoods: renting costs more than a mortgage payment. In ZIP 10462, the mortgage payment on a typical home would be roughly $1,270, while rent averages $2,542. That math flips in expensive areas. In Tribeca, the mortgage payment is triple the rent.
For the citywide median home, you’d need roughly $179,000 for a 20% down payment. The monthly mortgage would land around $4,770 — before taxes and insurance push total housing costs closer to $6,000–$6,500.
Population Growth and Migration
New York lost residents. Between 2020 and 2024, the city’s population dropped 3.0%, falling from 8.74 million to 8.48 million. That’s a loss of roughly 262,000 people — equivalent to a mid-size city disappearing.
| Year | Population | Change |
|---|---|---|
| 2020 | 8,740,306 | — |
| 2021 | 8,453,772 | -286,534 |
| 2022 | 8,356,179 | -97,593 |
| 2023 | 8,390,888 | +34,709 |
| 2024 | 8,478,072 | +87,184 |
The trajectory matters more than the headline number. The steepest drop hit in 2021, when nearly 287,000 residents left. By 2022, the losses slowed. Then the city started clawing people back — gaining about 35,000 in 2023 and 87,000 in 2024.
Meanwhile, smaller cities in New York state are growing:
| City | 2024 Population | 4-Year Growth |
|---|---|---|
| New Rochelle | 85,512 | +6.6% |
| White Plains | 62,561 | +5.0% |
| Albany | 101,317 | +2.7% |
| Schenectady | 69,495 | +1.7% |
| Yonkers | 211,040 | 0.0% |
New Rochelle and White Plains — both within commuting distance of Manhattan — grew the fastest. That pattern suggests some residents didn’t leave the region; they left the city for nearby suburbs. For the housing market, the population rebound since 2022 supports continued demand, even if the city hasn’t returned to its 2020 peak.
New York Housing Market Trends
Home values have risen every single month for the past year. The pace has been steady, not explosive — averaging about $2,600 in monthly gains.
| Month | Avg. Home Value | Monthly Change |
|---|---|---|
| Feb 2026 | $896,056 | +$6,570 |
| Jan 2026 | $889,486 | +$4,198 |
| Dec 2025 | $885,288 | +$2,811 |
| Nov 2025 | $882,477 | +$3,662 |
| Oct 2025 | $878,815 | +$3,733 |
| Sep 2025 | $875,082 | +$2,369 |
| Aug 2025 | $872,713 | +$896 |
| Jul 2025 | $871,817 | +$918 |
| Jun 2025 | $870,899 | +$1,564 |
| May 2025 | $869,335 | +$1,785 |
| Apr 2025 | $867,550 | +$2,413 |
| Mar 2025 | $865,137 | — |
Two patterns stand out. First, prices never declined — not a single red month in the entire 12-month window. Second, the gains are accelerating. From July through September 2025, monthly increases averaged under $1,400. By the last three months (December through February), they averaged over $4,500.
The total gain from March 2025 to February 2026 was $30,919 — a 3.6% increase on the starting value.
Is New York a Good Place to Buy in 2026?
The data points toward a seller’s market. Prices are rising, gains are accelerating, and there’s no sign of a pullback in the 12-month trend.
For buyers, the math depends entirely on where you’re looking. The Bronx offers entry points under $250K — manageable even with today’s mortgage rates. Manhattan below 14th Street requires seven figures and a high tolerance for carrying costs.
The rent-vs-buy calculation favors purchasing in affordable neighborhoods. In several Bronx and Queens ZIPs, mortgage payments undercut local rents. If you plan to stay long-term, buying in these areas locks in a fixed housing cost while rents continue rising.
The risk? Population loss between 2020 and 2022 was real. If another wave of outmigration hits, demand could soften. The recent rebound — 87,000 new residents in 2024 — is encouraging, but the city hasn’t fully recovered its 2020 headcount.
For most buyers, 2026 is a hold-steady market. Prices aren’t dropping, but they’re not surging so fast that waiting a few months will price you out.
New York Housing Market Outlook for 2026-2027
The three-month trend suggests continued upward movement. Monthly gains averaged $4,526 from December 2025 through February 2026 — the strongest stretch in the past year.
If the current pace continues through mid-2026, citywide values could push past the $900K mark by spring. The acceleration pattern — from sub-$1,000 monthly gains in summer 2025 to $6,570 in February 2026 — points to strengthening demand.
That said, the gains would need to sustain their recent pace, which isn’t guaranteed. Seasonal patterns typically bring stronger price growth in spring and summer, which could support or even amplify the trend. Mortgage rate changes remain the biggest wild card — a significant rate drop could push more buyers into the market, while rate increases would add pressure on affordability.
The floor looks firm. With 12 consecutive months of increases and no signs of a reversal, a near-term price decline seems unlikely barring a major economic disruption.
Frequently Asked Questions
What is the average home price in New York?
The average home price in New York is $896,056 as of February 2026. This figure represents the Zillow Home Value Index across 172 ZIP codes in the five boroughs. Actual prices range from $238,668 in the Bronx to $3,677,140 in Tribeca.
Are home prices going up or down in New York?
Home prices in New York are going up. Values increased 3.6% year over year, and the city recorded gains in all 12 months of tracked data. The most recent monthly increase (January to February 2026) was $6,570, the largest single-month gain in the past year.
Is it cheaper to rent or buy in New York?
It depends on the neighborhood. In affordable areas like the Bronx (ZIP 10462), a mortgage payment of roughly $1,270 is far cheaper than the $2,542 average rent. In expensive Manhattan neighborhoods, renting costs a fraction of buying. Citywide, the median mortgage payment of roughly $4,770 (before taxes and insurance) exceeds typical rents of $3,100–$3,500 in many areas.
What is the most affordable neighborhood in New York?
ZIP code 10462 in the Parkchester area of the Bronx has the lowest typical home value at $238,668. Several other Bronx ZIP codes — including 10468 ($268,268) and 10452 ($319,081) — also offer homes well below the citywide median of $896,056.
Methodology
Home values are based on the Zillow Home Value Index (ZHVI), a smoothed measure of typical home values in the 35th to 65th percentile range. Rent estimates use the Zillow Observed Rent Index (ZORI). Population figures come from the U.S. Census Bureau Population Estimates Program (2020-2024 vintage). All datasets are publicly available. Housing data updated 2026-02-28.