Average Home Price in Phoenix AZ (2026): Trends & Data
$457,388. That’s what a typical home costs in Phoenix right now. Prices are down 1.5% compared to a year ago, but the decline hasn’t been dramatic — more of a slow drift than a crash.
Quick answer: The average home price in Phoenix, AZ is $457,388 as of February 2026, down 1.5% year over year according to Zillow.
Current Home Prices in Phoenix
Phoenix home values sit in a wide band depending on where you look. The cheapest ZIP code comes in under $280K. The most expensive tops $986K. That’s a spread of nearly $710,000 within city limits.
| Metric | Value |
|---|---|
| Median home value | $457,388 |
| Year-over-year change | -1.5% |
| Lowest value (ZIP 85034) | $276,288 |
| Highest value (ZIP 85018) | $986,154 |
| ZIP codes tracked | 43 |
The 1.5% annual decline doesn’t tell the full story. Prices bottomed out in October 2025 at $453,395 and have ticked up in each of the four months since. February’s $457,388 is $3,993 higher than October’s low. That’s a modest recovery — about 0.9% in four months — but the direction has flipped.
If you bought at the peak last spring, you’re looking at roughly $7,000 less in home value. Not catastrophic, but not the appreciation homeowners got used to in earlier years.
The price range across Phoenix is striking. You can find a home in the mid-$270Ks in some south Phoenix neighborhoods, or spend nearly $1 million in the Arcadia corridor. Same city, very different markets.
Phoenix Home Prices by Neighborhood
Phoenix spans 43 ZIP codes with tracked home values. The gap between the cheapest and priciest neighborhoods is over $700,000.
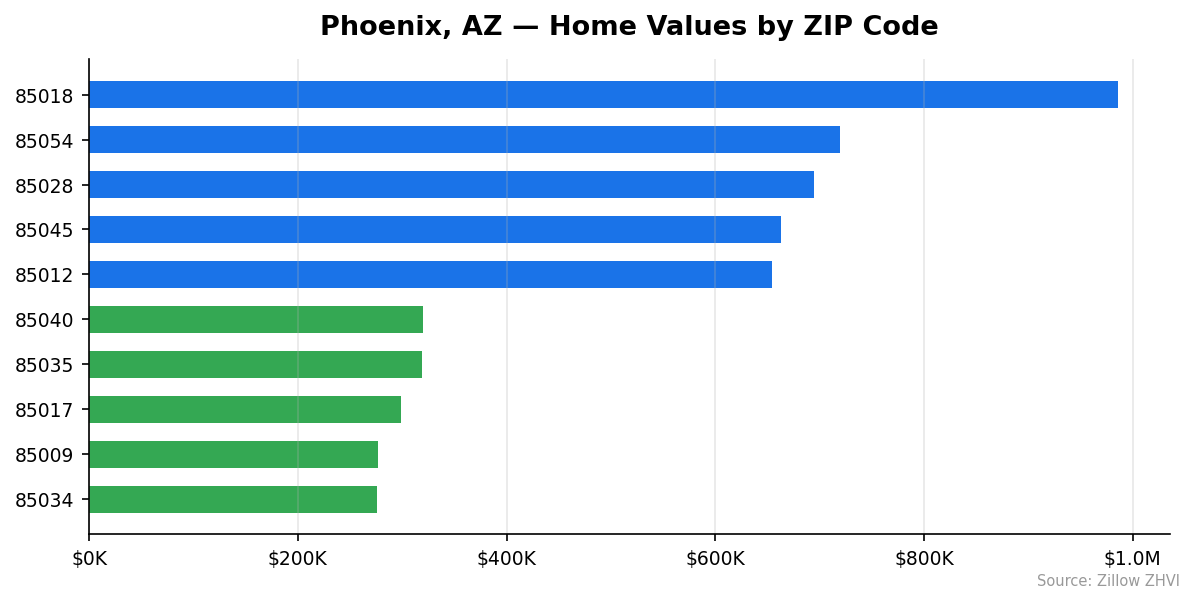
Top 10 Most Expensive ZIP Codes
| ZIP Code | Typical Home Value |
|---|---|
| 85018 | $986,154 |
| 85054 | $719,749 |
| 85028 | $694,892 |
| 85045 | $662,963 |
| 85012 | $653,946 |
| 85085 | $639,219 |
| 85050 | $622,226 |
| 85083 | $622,034 |
| 85003 | $586,290 |
| 85048 | $580,836 |
ZIP 85018 — the Arcadia and Camelback East area — is in a league of its own at $986,154. That’s more than double the citywide median. The next closest, 85054 in the Desert Ridge area, is $266K cheaper.
Top 10 Most Affordable ZIP Codes
| ZIP Code | Typical Home Value |
|---|---|
| 85034 | $276,288 |
| 85009 | $277,289 |
| 85017 | $298,704 |
| 85035 | $319,074 |
| 85040 | $319,663 |
| 85031 | $320,104 |
| 85019 | $323,517 |
| 85033 | $323,721 |
| 85015 | $336,654 |
| 85051 | $341,886 |
Buyers on a budget should look south and west. Seven of the ten cheapest ZIPs are below $325K. ZIP 85034 near Sky Harbor airport offers the lowest entry point at $276,288 — 40% below the city median.
Rent vs Buy in Phoenix
Monthly rents in Phoenix range from $1,127 in ZIP 85015 to $2,646 in ZIP 85083. Here’s how rents compare across price tiers.
Rent by Neighborhood (Selected ZIPs)
| ZIP Code | Home Value | Monthly Rent |
|---|---|---|
| 85015 | $336,654 | $1,127 |
| 85009 | $277,289 | $1,207 |
| 85021 | $434,163 | $1,184 |
| 85022 | $461,920 | $1,406 |
| 85044 | $476,837 | $1,547 |
| 85048 | $580,836 | $1,899 |
| 85050 | $622,226 | $2,460 |
| 85028 | $694,892 | $2,537 |
| 85083 | $622,034 | $2,646 |
| 85018 | $986,154 | $1,635 |
One number jumps out: ZIP 85018 has the highest home values ($986K) but a rent of just $1,635. If you want to live in Arcadia, renting looks far more attractive than buying. On the other end, ZIP 85083 has relatively high rents ($2,646) for its home value, narrowing the gap between renting and owning.
A rough mortgage payment on the citywide median of $457,388 — assuming 20% down and a 7% rate — runs about $2,430 per month for principal and interest alone. Add property taxes and insurance, and you’re likely above $2,900. That’s well above what most Phoenix renters pay. For many buyers, the monthly cost of owning is significantly higher than renting the same type of home.
Population Growth and Migration
Phoenix is the fifth-largest city in the country, and it’s still growing. The population hit 1,673,164 in 2024, up 3.8% from 2020.
| Year | Population |
|---|---|
| 2020 | 1,612,593 |
| 2021 | 1,625,132 |
| 2022 | 1,644,798 |
| 2023 | 1,656,231 |
| 2024 | 1,673,164 |
That’s roughly 60,571 new residents over four years — an average of about 15,000 per year. Growth has been steady, not explosive.
The suburbs are a different story. Several nearby cities are growing much faster than Phoenix itself.
| City | 2024 Population | Growth (2020–2024) |
|---|---|---|
| Goodyear | 118,186 | 20.8% |
| Surprise | 167,564 | 16.0% |
| Gilbert | 288,790 | 7.2% |
| Peoria | 199,924 | 4.1% |
| Glendale | 258,143 | 3.7% |
Goodyear’s population surged 20.8% in four years. Surprise grew 16%. Both are far west Valley suburbs where land is cheaper and new construction is abundant. This suburban boom puts indirect pressure on Phoenix’s housing market — it pulls demand away from city neighborhoods but also signals strong regional interest in the metro area overall.
More people means more housing demand, but Phoenix’s relatively soft price decline (-1.5% YoY) suggests that new supply has kept pace with population growth for now.
Phoenix Housing Market Trends
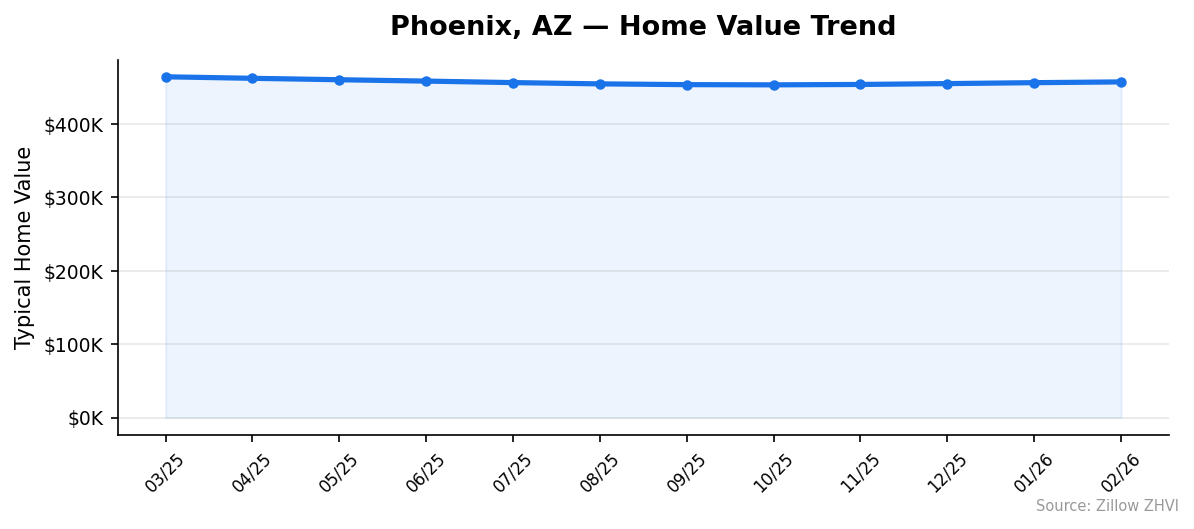
Here’s how the average home value in Phoenix has moved over the past 12 months.
| Month | Avg Home Value | Monthly Change |
|---|---|---|
| March 2025 | $464,379 | — |
| April 2025 | $462,310 | -$2,069 |
| May 2025 | $460,359 | -$1,951 |
| June 2025 | $458,507 | -$1,852 |
| July 2025 | $456,461 | -$2,046 |
| August 2025 | $454,743 | -$1,718 |
| September 2025 | $453,681 | -$1,062 |
| October 2025 | $453,395 | -$286 |
| November 2025 | $453,940 | +$545 |
| December 2025 | $455,101 | +$1,161 |
| January 2026 | $456,368 | +$1,267 |
| February 2026 | $457,388 | +$1,020 |
The pattern is clear. Prices fell steadily from March through October 2025 — seven straight months of decline. The drops got smaller each month, from -$2,069 in April to just -$286 in October. Then the trend reversed.
November marked the first monthly gain. Prices have now risen for four consecutive months, adding roughly $4,000 since the October low. The recovery is gradual — each monthly gain has been about $1,000 — but the direction is consistent.
The total decline from the March 2025 peak to the October 2025 trough was about $11,000, or 2.4%. About a third of that loss has been recovered.
Is Phoenix a Good Place to Buy in 2026?
The data points to a market in transition. Prices are no longer falling, but they haven’t returned to last year’s highs either.
For buyers, this creates an opening. You’re buying below the 12-month peak. The year-over-year decline of 1.5% means sellers have less bargaining power than they did in early 2025. If you find a home in one of the affordable ZIPs — 85034, 85009, or 85017 — you’re looking at entry prices under $300K in a major metro area.
For sellers, the four months of recovery offer some encouragement, but the pace is slow. Listing now means pricing into a market that’s still 1.5% below where it was a year ago.
The rental math complicates the buy decision. With monthly ownership costs well above typical rents, buying only makes sense if you plan to stay long enough for appreciation to close the gap. In a flat or slowly rising market, that timeline stretches out.
Phoenix’s population growth (3.8% over four years) provides a floor for demand. People are still moving here. The suburbs are absorbing much of that growth, but the city itself added over 60,000 residents since 2020.
Phoenix Housing Market Outlook for 2026-2027
The four-month recovery trend suggests Phoenix prices will continue inching upward through spring and summer 2026. Historically, home values tend to rise in warmer months as buying activity picks up, and the data already shows that pattern beginning.
If the current pace continues — roughly $1,000 per month in gains — Phoenix could approach $460K to $465K by mid-2026. That would bring values close to where they were in spring 2025, but likely not above the March 2025 peak of $464,379.
The 3-month trend from December through February shows consistent but decelerating gains ($1,161 → $1,267 → $1,020). This suggests the recovery may plateau rather than accelerate. A return to strong year-over-year appreciation looks unlikely based on the current data.
Watch the suburban growth pattern. If fast-growing cities like Goodyear and Surprise continue pulling buyers with cheaper new construction, that could cap how high Phoenix proper can go.
Frequently Asked Questions
What is the average home price in Phoenix?
The average home price in Phoenix is $457,388 as of February 2026. This figure represents the typical home value across 43 ZIP codes tracked in the metro area. Prices range from $276,288 in ZIP 85034 to $986,154 in ZIP 85018.
Are home prices going up or down in Phoenix?
Phoenix home prices are down 1.5% year over year. However, month-over-month prices have been rising since November 2025, with four consecutive months of gains. The market appears to have bottomed out in October 2025 at $453,395.
Is it cheaper to rent or buy in Phoenix?
Renting is cheaper than buying in most Phoenix neighborhoods right now. Monthly rents range from $1,127 to $2,646 depending on the ZIP code, while a mortgage payment on the median-priced home would run roughly $2,430 per month before taxes and insurance. The gap is especially wide in high-value areas like ZIP 85018, where rent is $1,635 but homes cost $986K.
What is the most affordable neighborhood in Phoenix?
ZIP code 85034, near Sky Harbor International Airport, is the most affordable at $276,288 — about 40% below the citywide median. ZIP 85009 is a close second at $277,289. Both neighborhoods offer entry points well under $300,000.
Methodology
Home values are based on the Zillow Home Value Index (ZHVI), a smoothed measure of typical home values in the 35th to 65th percentile range. Rent estimates use the Zillow Observed Rent Index (ZORI). Population figures come from the U.S. Census Bureau Population Estimates Program (2020–2024 vintage). All datasets are publicly available. Housing data updated 2026-02-28.