Average Home Price in Portland OR (2026): Trends & Data
$543,742. That’s what a typical home in Portland costs right now — and it’s actually less than it was a year ago. The metro area’s median home value slipped 0.8% year over year as of February 2026, marking a market that’s still adjusting after years of rapid appreciation.
Quick answer: The average home price in Portland, OR is $543,742 as of February 2026, down 0.8% year over year according to Zillow.
Current Home Prices in Portland
The Portland-Vancouver-Hillsboro metro area shows a market in mild correction. Prices fell year over year, but the decline is less than 1% — a near-flat reading that suggests stabilization rather than a steep slide.
| Metric | Value |
|---|---|
| Median home value | $543,742 |
| Year-over-year change | -0.8% |
| Lowest ZIP code value | $352,020 |
| Highest ZIP code value | $774,370 |
| ZIP codes tracked | 28 |
The gap between the cheapest and most expensive neighborhoods is wide. A buyer in the most affordable ZIP pays $352,020. In the priciest, $774,370. That’s a $422,000 spread across the same city.
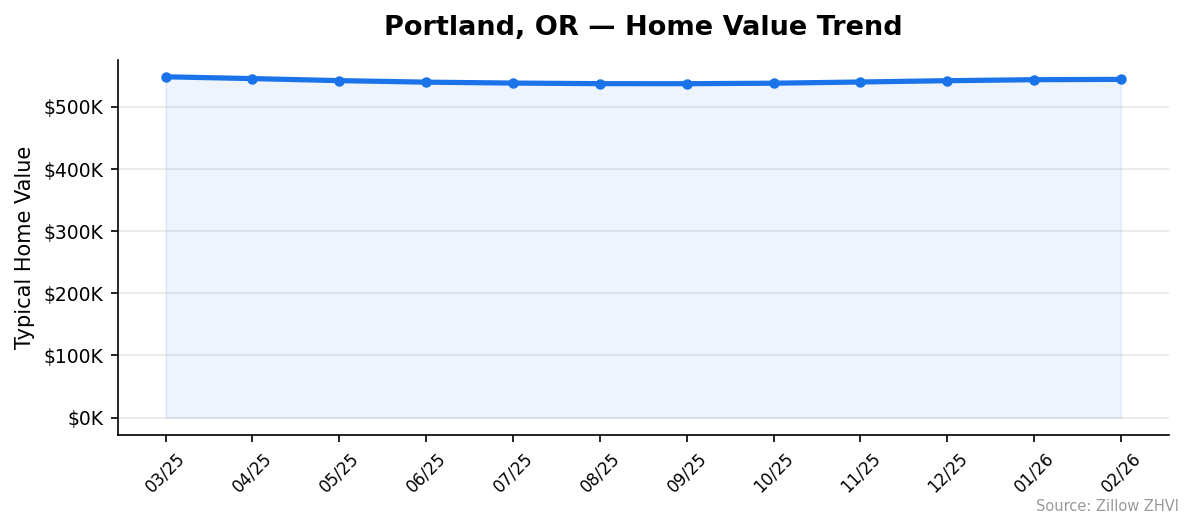
What the year-over-year number doesn’t show is the recent direction. Portland’s median bottomed out around $536,787 in September 2025 and has climbed roughly $7,000 since then. The annual comparison still reads negative because prices were higher in early 2025, but month-to-month momentum has turned positive.
If you’re watching Portland from the sidelines, the takeaway is simple: prices aren’t cratering, and they aren’t surging. The market is flat with a slight downward tilt year over year and a slight upward tilt in recent months.
Portland Home Prices by Neighborhood
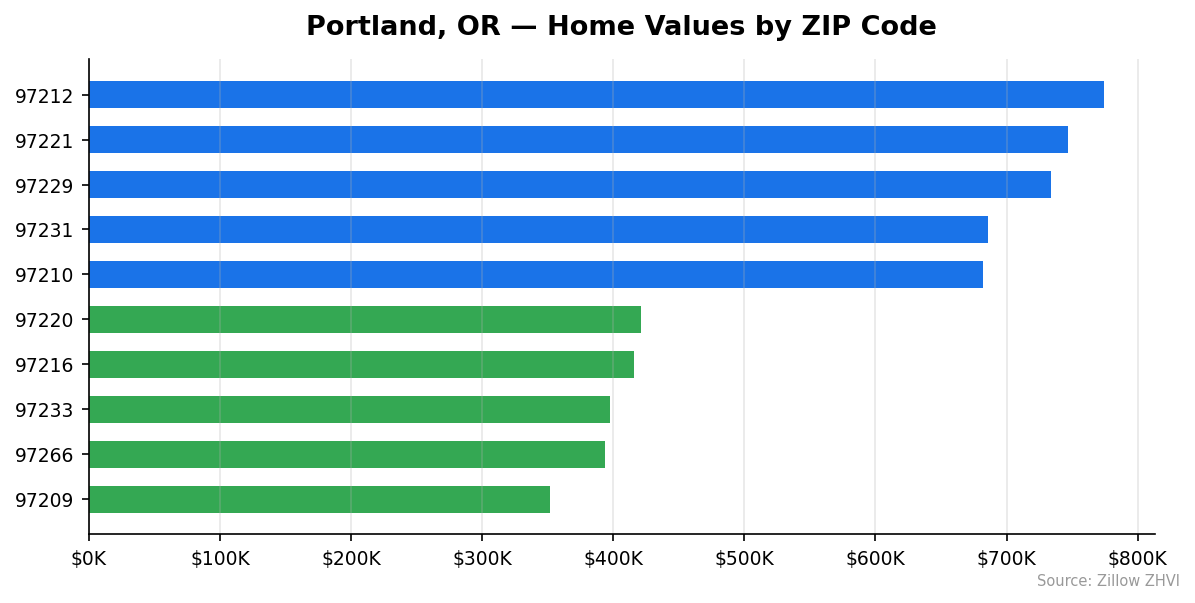
Portland’s 28 tracked ZIP codes show a wide range of affordability. Here are the ten most and least expensive neighborhoods by typical home value.
Most Expensive ZIPs
| ZIP Code | Typical Home Value |
|---|---|
| 97212 | $774,370 |
| 97221 | $747,052 |
| 97229 | $733,685 |
| 97231 | $686,163 |
| 97210 | $682,333 |
| 97214 | $667,967 |
| 97232 | $639,598 |
| 97215 | $634,127 |
| 97219 | $622,007 |
| 97202 | $616,090 |
Most Affordable ZIPs
| ZIP Code | Typical Home Value |
|---|---|
| 97209 | $352,020 |
| 97266 | $393,970 |
| 97233 | $397,424 |
| 97216 | $416,000 |
| 97220 | $421,227 |
| 97236 | $428,696 |
| 97201 | $432,081 |
| 97203 | $446,502 |
| 97230 | $451,006 |
| 97206 | $459,698 |
ZIP 97212 — covering the Irvington and Alameda neighborhoods — tops the list at $774,370, more than double the cheapest ZIP. The east side of Portland generally offers more affordable entry points, with ZIPs like 97233, 97236, and 97266 all coming in under $430,000.
For buyers on a budget, 97209 is the only ZIP below $360,000. But keep in mind that 97209 covers the Pearl District and parts of Northwest Portland, where smaller condos and apartments pull the median down.
Rent vs Buy in Portland
Renting costs less per month than buying, and the gap is wide.
Typical monthly rents across Portland’s ZIP codes range from $1,532 to $2,023. Here’s how rents break down across select neighborhoods:
| ZIP Code | Typical Home Value | Typical Monthly Rent |
|---|---|---|
| 97218 | $466,701 | $2,023 |
| 97212 | $774,370 | $2,017 |
| 97229 | $733,685 | $1,987 |
| 97219 | $622,007 | $1,976 |
| 97211 | $556,937 | $1,944 |
| 97266 | $393,970 | $1,914 |
| 97209 | $352,020 | $1,778 |
| 97233 | $397,424 | $1,550 |
| 97230 | $451,006 | $1,532 |
A few things stand out. ZIP 97266, one of the cheapest areas to buy at $393,970, has rents of $1,914 — among the highest in the city. That’s a mismatch that could signal strong rental demand in that area.
Meanwhile, the most expensive ZIP to buy (97212, $774,370) has rents of $2,017 per month. You’d pay roughly 3.1x more in monthly housing costs to own versus rent there, before factoring in taxes, insurance, and maintenance.
Across the board, renting runs roughly $1,500 to $2,000 per month. Buying a $544,000 home with 20% down means financing about $435,000 — a monthly mortgage payment that far exceeds these rent levels at current interest rates. The math favors renting on a pure cash-flow basis, though buyers build equity over time.
Population Growth and Migration
Portland is shrinking. The city lost 17,417 residents between 2020 and 2024 — a 2.7% decline.
| Year | Population |
|---|---|
| 2020 | 653,166 |
| 2021 | 642,803 |
| 2022 | 636,093 |
| 2023 | 634,314 |
| 2024 | 635,749 |
The sharpest drop came between 2020 and 2021, when Portland lost over 10,000 people in a single year. The bleeding slowed after that, and 2024 actually showed a small rebound — up about 1,400 from 2023. Still, the city remains well below its 2020 peak.
Compare that to other Oregon cities:
| City | 2024 Population | Growth (2020-2024) |
|---|---|---|
| Bend | 106,926 | +7.3% |
| Corvallis | 61,993 | +6.3% |
| Tigard | 57,301 | +4.1% |
| Hillsboro | 110,337 | +3.0% |
| Salem | 180,406 | +2.5% |
Every comparable Oregon city is growing. Bend added 7.3% in four years. Even suburban Tigard, right next to Portland, grew 4.1%.
For the housing market, population loss eases demand pressure. Fewer people competing for homes helps explain why Portland’s prices dipped while many other markets held firm. The 2024 population uptick is worth watching — if residents start returning, demand could tighten again.
Portland Housing Market Trends
Here’s how Portland’s median home value moved over the past 12 months:
| Month | Median Value | Min ZIP | Max ZIP |
|---|---|---|---|
| Mar 2025 | $547,900 | $384,768 | $760,010 |
| Apr 2025 | $545,002 | $381,483 | $757,338 |
| May 2025 | $541,733 | $378,039 | $752,899 |
| Jun 2025 | $539,283 | $374,579 | $747,810 |
| Jul 2025 | $537,802 | $370,662 | $745,790 |
| Aug 2025 | $536,872 | $367,304 | $747,354 |
| Sep 2025 | $536,787 | $364,964 | $750,203 |
| Oct 2025 | $537,592 | $363,517 | $753,569 |
| Nov 2025 | $539,516 | $361,268 | $759,450 |
| Dec 2025 | $541,621 | $358,477 | $765,540 |
| Jan 2026 | $543,217 | $355,014 | $771,222 |
| Feb 2026 | $543,742 | $352,020 | $774,370 |
The pattern is clear: prices fell from March through September 2025, then reversed. The bottom was September at $536,787. Since then, the median has risen for five straight months, adding roughly $7,000.
An interesting divergence is happening at the extremes. The cheapest ZIPs are getting cheaper — the minimum fell from $384,768 in March 2025 to $352,020 in February 2026. Meanwhile, the most expensive ZIPs are getting pricier, with the max rising from $760,010 to $774,370 over the same period. The market is splitting: high-end areas are recovering faster while affordable areas continue to soften.
Is Portland a Good Place to Buy in 2026?
The data paints a picture of a buyer-friendly market — at least compared to the frenzy of 2021-2022.
Prices are down 0.8% year over year. The city lost population. Inventory has had time to build. If you’re a buyer, you have more negotiating power than you did two years ago.
But “buyer-friendly” doesn’t mean “cheap.” The median is still $543,742. You need to clear half a million dollars to buy a typical Portland home. In the most affordable ZIP, you’re still looking at $352,020.
The rent-versus-buy math also matters. With rents running $1,500 to $2,000 and ownership costs running higher, buying makes more sense if you plan to stay at least five to seven years and want to build equity. For shorter timelines, renting is the simpler financial play.
Portland’s five-month price rebound suggests the floor may be in. If you’ve been waiting for a dip, this might be as good as it gets — though no one can predict the next 12 months with certainty.
Portland Housing Market Outlook for 2026-2027
The five-month uptrend from September 2025 through February 2026 suggests prices are stabilizing. The monthly gains have been modest — roughly $1,000 to $2,000 per month — which points to a slow grind upward rather than a sharp rebound.
If the current pace continues, Portland could end 2026 somewhere in the $545,000 to $555,000 range. That would represent a recovery to roughly where the market was in early 2025.
The 3-month trend from December 2025 to February 2026 shows gains of about $700 per month, a deceleration from the October-November pace. This isn’t unusual — winter months tend to be slower. Spring and summer activity could accelerate the recovery, or it could stall.
The population rebound in 2024 is a cautiously positive sign for demand. If that trend holds, it removes one of the headwinds that pushed prices down.
Frequently Asked Questions
What is the average home price in Portland?
The average home price in Portland, OR is $543,742 as of February 2026. This figure represents the typical home value across 28 ZIP codes in the Portland-Vancouver-Hillsboro metro area. Prices range from $352,020 to $774,370 depending on neighborhood.
Are home prices going up or down in Portland?
Portland home prices are down 0.8% compared to a year ago. However, the trend has shifted: prices bottomed in September 2025 at $536,787 and have risen for five consecutive months since then. The year-over-year number is still negative, but the recent direction is up.
Is it cheaper to rent or buy in Portland?
Renting is cheaper on a monthly basis. Typical rents across Portland range from about $1,532 to $2,023 per month. Buying a median-priced home at $543,742 with 20% down means financing roughly $435,000, which at current mortgage rates costs significantly more per month than renting. Buying builds equity over time, but the monthly cash outlay favors renting.
What is the most affordable neighborhood in Portland?
ZIP code 97209 has the lowest typical home value at $352,020. This area covers the Pearl District and parts of Northwest Portland, where condos and smaller units pull the median lower. The next most affordable areas are 97266 (Lents) at $393,970 and 97233 (Gateway) at $397,424.
Methodology
Home values are based on the Zillow Home Value Index (ZHVI), a smoothed measure of typical home values in the 35th to 65th percentile range. Rent estimates use the Zillow Observed Rent Index (ZORI). Population figures come from the U.S. Census Bureau Population Estimates Program (2020-2024 vintage). All datasets are publicly available. Housing data updated 2026-02-28.