Average Home Price in Salt Lake City (2026): Trends & Data
$583,082. That’s what a typical home costs in Salt Lake City right now. Prices are up 0.8% compared to a year ago — modest growth, but growth nonetheless, after a mid-2025 dip that briefly pushed values below $572,000.
Quick answer: The average home price in Salt Lake City, UT is $583,082 as of February 2026, up 0.8% year over year according to Zillow.
Current Home Prices in Salt Lake City
The Salt Lake City housing market has settled into a slow-growth pattern. The median home value sits at $583,082, with prices across the city’s eight tracked ZIP codes ranging from $404,713 to $915,263.
| Metric | Value |
|---|---|
| Median home value | $583,082 |
| Year-over-year change | +0.8% |
| Lowest ZIP value | $404,713 (84104) |
| Highest ZIP value | $915,263 (84108) |
| ZIP codes tracked | 8 |
A 0.8% annual gain barely keeps pace with inflation. For homeowners, that means equity is growing slowly. For buyers, it means the market isn’t running away from you — but it isn’t getting cheaper either.
The price floor held steady near $400,000 throughout the past twelve months, while the ceiling climbed from $891,433 in March 2025 to $915,263 in February 2026. The gap between the cheapest and most expensive neighborhoods widened by about $24,000 over that span.
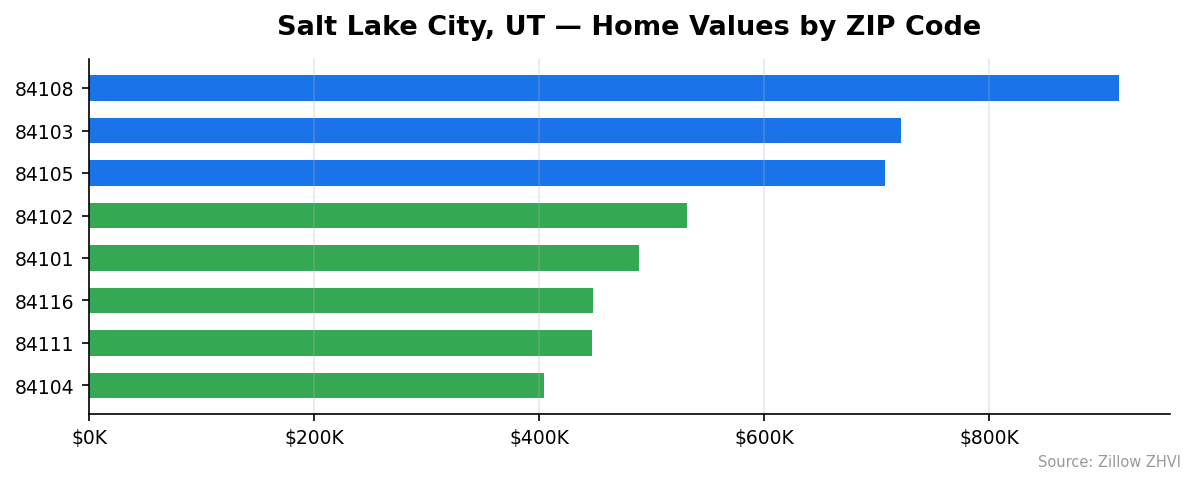
Salt Lake City Home Prices by Neighborhood
Not all Salt Lake City ZIP codes are priced equally. The spread between the most and least expensive area is over $510,000.
| ZIP Code | Typical Home Value | Typical Monthly Rent |
|---|---|---|
| 84108 | $915,263 | $2,853 |
| 84103 | $722,155 | $1,556 |
| 84105 | $707,363 | $1,818 |
| 84102 | $531,698 | $1,538 |
| 84101 | $488,487 | $1,668 |
| 84116 | $447,686 | $1,248 |
| 84111 | $447,286 | $1,808 |
| 84104 | $404,713 | $1,838 |
The east side dominates the high end. ZIP 84108 — covering the Foothill and University neighborhoods — is the only area above $900,000. It also commands the highest rents at $2,853 per month.
The most affordable option is 84104 on the west side at $404,713. Interestingly, its rent ($1,838) is higher than several pricier ZIP codes, which suggests strong rental demand relative to home values. If you’re looking for a neighborhood where buying might make more financial sense than renting, 84104 deserves a closer look.
ZIP 84116 offers the cheapest rent in the city at $1,248 per month, paired with a home value of $447,686.
Rent vs Buy in Salt Lake City
The monthly math favors renting — and it’s not close.
Take the median home value of $583,082. Put 20% down ($116,616) and finance the remaining $466,466 at a 7% mortgage rate. Your monthly principal and interest payment comes to roughly $3,103. Add property taxes and insurance, and you’re likely above $3,500 per month before maintenance.
Now compare that to rent. Across Salt Lake City’s eight ZIP codes, rents range from $1,248 to $2,853. The citywide midpoint falls around $1,668 per month.
| Cost | Monthly Amount |
|---|---|
| Estimated mortgage (P&I, 20% down, 7%) | ~$3,103 |
| Median area rent | ~$1,668 |
| Monthly difference | ~$1,435 |
Buying costs nearly twice as much per month as renting. That gap matters. But the comparison isn’t apples to apples — mortgage payments build equity, and homeowners lock in their housing cost while rents can rise. With prices growing at just 0.8% annually, though, the equity argument is weaker than it would be in a fast-appreciating market.
If you can invest that $1,435 monthly difference, renting may be the better financial move right now. If you plan to stay five-plus years and value stability, buying still has merit.
Population Growth and Migration
Salt Lake City added over 17,000 residents in four years. The population grew from 200,666 in 2020 to 217,783 in 2024 — an 8.5% increase.
| Year | Population |
|---|---|
| 2020 | 200,666 |
| 2021 | 201,161 |
| 2022 | 208,579 |
| 2023 | 211,833 |
| 2024 | 217,783 |
Growth accelerated after 2021. The city added just 495 people that first year, then jumped by 7,418 in 2022. The pace has held steady since, with roughly 6,000 new residents each year.
How does Salt Lake City compare to other Utah cities?
| City | 2024 Population | 4-Year Growth |
|---|---|---|
| Salt Lake City | 217,783 | 8.5% |
| St. George | 106,288 | 10.7% |
| South Jordan | 86,156 | 10.5% |
| Lehi | 93,446 | 21.6% |
| Ogden | 88,656 | 1.6% |
| Layton | 84,348 | 2.8% |
Lehi is the state’s growth leader at 21.6%, driven by Utah’s tech corridor. Salt Lake City’s 8.5% is solid for a city its size. More people means more housing demand — a factor that puts a floor under home prices even when the broader market softens.
Salt Lake City Housing Market Trends
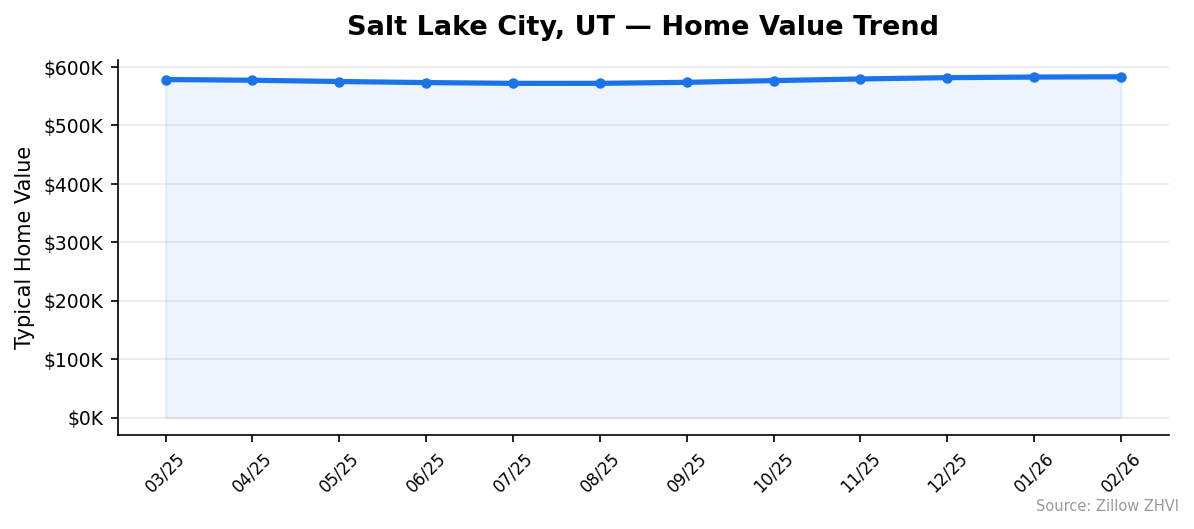
The past twelve months tell a story of correction and recovery. Prices peaked in spring 2025, dipped through summer, and have climbed steadily since August.
| Month | Avg. Home Value | Monthly Change |
|---|---|---|
| Mar 2025 | $578,403 | — |
| Apr 2025 | $577,172 | -$1,231 |
| May 2025 | $575,001 | -$2,171 |
| Jun 2025 | $573,168 | -$1,833 |
| Jul 2025 | $571,868 | -$1,300 |
| Aug 2025 | $571,890 | +$22 |
| Sep 2025 | $573,586 | +$1,696 |
| Oct 2025 | $576,567 | +$2,981 |
| Nov 2025 | $579,379 | +$2,812 |
| Dec 2025 | $581,615 | +$2,236 |
| Jan 2026 | $582,634 | +$1,019 |
| Feb 2026 | $583,082 | +$448 |
The low point was July 2025 at $571,868 — a 1.1% drop from the March 2025 level. Since then, prices have risen for seven straight months, recovering the lost ground and pushing to new highs.
One thing worth watching: the pace of monthly gains is slowing. October saw a $2,981 jump. By February, the gain was just $448. The recovery may be leveling off.
Is Salt Lake City a Good Place to Buy in 2026?
The data points to a balanced market. Prices are rising, but barely — 0.8% year over year won’t price you out next month.
For buyers, the lack of rapid appreciation means less urgency. You have time to find the right home without fear of prices jumping 10% while you search. The wide price range ($404,713 to $915,263) means options exist at multiple budget levels.
For sellers, slow growth means pricing your home right matters more than ever. Overpriced listings will sit.
The rent-vs-buy math currently favors renting on a pure monthly cost basis. But if mortgage rates drop — even by half a point — the equation shifts. Buyers who lock in now at a price that fits their budget are positioned well if rates eventually decline and prices hold.
Population growth of 8.5% in four years supports long-term demand. Salt Lake City isn’t shrinking, and new residents need places to live.
Salt Lake City Housing Market Outlook for 2026-2027
The seven-month upward trend suggests prices will continue rising through spring and summer 2026. That tracks with typical seasonal patterns — home values tend to firm up as buying season heats up.
However, the decelerating monthly gains (from $2,981 in October to $448 in February) signal the recovery is losing momentum. If the current pace continues, you can expect modest appreciation in the 1-2% annual range rather than any sharp moves upward.
The mid-2025 dip and subsequent rebound created a clear price floor near $571,000. Unless economic conditions change significantly, that floor likely holds. The data does not support expecting a major correction or a major surge. Expect more of the same: slow, grinding growth.
Frequently Asked Questions
What is the average home price in Salt Lake City?
The average home price in Salt Lake City is $583,082 as of February 2026. Prices range from $404,713 in ZIP code 84104 to $915,263 in 84108, depending on the neighborhood.
Are home prices going up or down in Salt Lake City?
Prices are going up. Salt Lake City home values increased 0.8% year over year. After dipping to $571,868 in July 2025, prices have risen for seven consecutive months.
Is it cheaper to rent or buy in Salt Lake City?
Renting is cheaper on a monthly basis. A mortgage on a median-priced home with 20% down at 7% costs roughly $3,103 per month in principal and interest. Rent in the city ranges from $1,248 to $2,853 depending on the neighborhood, with a midpoint around $1,668.
What is the most affordable neighborhood in Salt Lake City?
ZIP code 84104 has the lowest typical home value at $404,713. ZIP 84111 is a close second at $447,286. Both are well below the citywide median of $583,082.
Methodology
Home values are based on the Zillow Home Value Index (ZHVI), a smoothed measure of typical home values in the 35th to 65th percentile range. Rent estimates use the Zillow Observed Rent Index (ZORI). Population figures come from the U.S. Census Bureau Population Estimates Program (2020-2024 vintage). All datasets are publicly available. Housing data updated 2026-02-28.