Average Home Price in San Antonio TX (2026): Trends & Data
$279,198. That’s what a typical home costs in San Antonio right now. Prices are down 1.9% from a year ago, marking a slow but steady decline across all 56 ZIP codes tracked in the metro area.
Quick answer: The average home price in San Antonio, TX is $279,198 as of February 2026, down 1.9% year over year according to Zillow.
Current Home Prices in San Antonio
The San Antonio-New Braunfels metro area sits well below the national spotlight, but the numbers tell a clear story. The market is softening.
| Metric | Value |
|---|---|
| Median Home Value | $279,198 |
| Year-over-Year Change | -1.9% |
| Lowest ZIP Code Value | $108,729 |
| Highest ZIP Code Value | $912,768 |
| ZIP Codes Tracked | 56 |
That 1.9% annual drop doesn’t sound dramatic, but it matters if you bought at the peak. A homeowner who purchased at the March 2025 median of $284,562 has seen roughly $5,400 in paper losses over 11 months.
The spread between the cheapest and most expensive ZIP codes is enormous — more than $800,000 separates the two ends. San Antonio is not one market. It’s dozens of micro-markets stacked inside city limits.
For buyers, the slow decline creates a window. You’re not chasing prices upward. For sellers, the data suggests pricing aggressively rather than waiting for a spring bounce that hasn’t materialized.
San Antonio Home Prices by Neighborhood
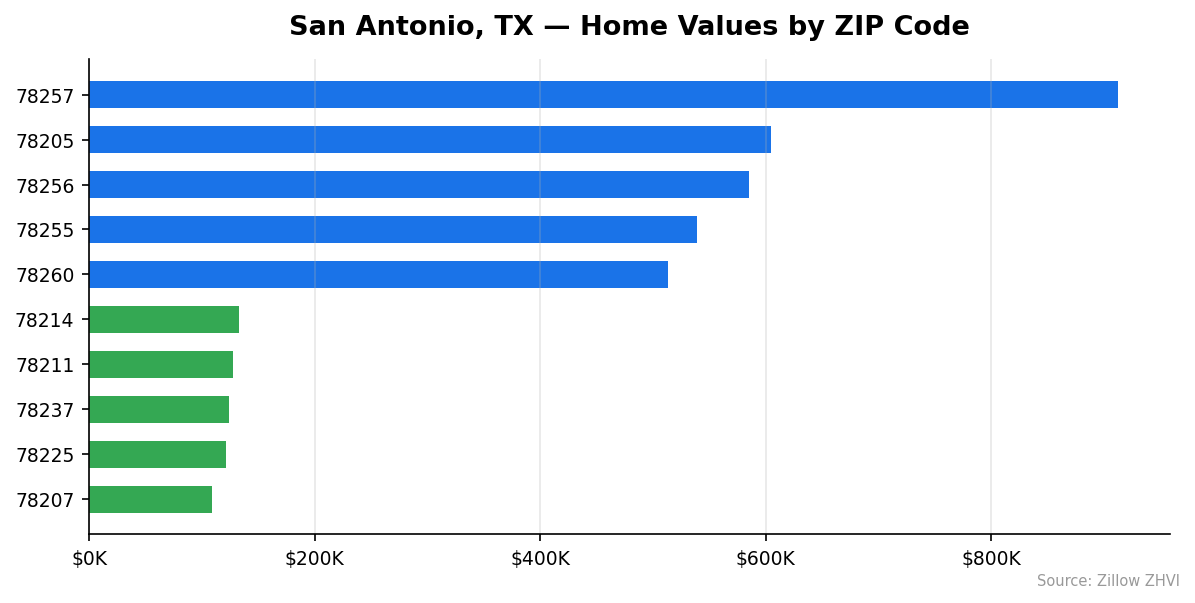
San Antonio’s 56 ZIP codes range from entry-level neighborhoods under $110K to luxury enclaves above $900K. Here are the ten most and least expensive.
Most Expensive ZIP Codes
| ZIP Code | Typical Home Value |
|---|---|
| 78257 | $912,768 |
| 78205 | $604,514 |
| 78256 | $585,292 |
| 78255 | $538,827 |
| 78260 | $513,400 |
| 78258 | $496,835 |
| 78248 | $491,099 |
| 78209 | $463,221 |
| 78231 | $442,870 |
| 78261 | $436,907 |
Most Affordable ZIP Codes
| ZIP Code | Typical Home Value |
|---|---|
| 78207 | $108,729 |
| 78225 | $121,131 |
| 78237 | $123,681 |
| 78211 | $127,369 |
| 78214 | $133,396 |
| 78226 | $134,745 |
| 78220 | $148,907 |
| 78242 | $152,045 |
| 78203 | $154,285 |
| 78202 | $155,681 |
ZIP 78257 is a clear outlier at $912,768 — more than three times the citywide median. Meanwhile, 78207 at $108,729 offers homes at 39% of the median price. If you’re looking for affordability, the south and west sides of the city dominate the bottom of the list. The priciest areas cluster in the far north, around the Stone Oak and Shavano Park corridors.
Rent vs Buy in San Antonio
Renting is cheaper on a monthly basis in most San Antonio neighborhoods — but the gap isn’t as wide as you might expect.
A mortgage on the median home ($279,198) with 20% down at a 7% interest rate works out to roughly $1,486 per month in principal and interest alone. Add property taxes and insurance, and you’re likely above $1,800.
Here’s how rents compare in selected ZIP codes:
| ZIP Code | Typical Home Value | Typical Monthly Rent |
|---|---|---|
| 78245 | $256,016 | $1,482 |
| 78254 | $305,567 | $1,805 |
| 78250 | $241,149 | $1,477 |
| 78233 | $229,535 | $1,328 |
| 78216 | $281,607 | $1,234 |
| 78212 | $275,844 | $1,459 |
| 78207 | $108,729 | $1,137 |
| 78255 | $538,827 | $1,965 |
Rents across the city mostly fall between $1,100 and $1,700. The cheapest rent belongs to ZIP 78214 at $997 per month. The most expensive is 78205 at $1,981.
In the mid-range neighborhoods, monthly rent and a mortgage payment on the same home are surprisingly close. That narrows the financial argument for renting. But buying locks in your payment while rents can rise — and in a market where prices are dipping, buyers may pick up equity later if values recover.
Population Growth and Migration
San Antonio is gaining residents at a steady clip. The city’s population hit 1,526,656 in 2024, up 6.1% from 1,439,340 in 2020. That’s roughly 87,300 new residents in four years.
| Year | Population |
|---|---|
| 2020 | 1,439,340 |
| 2021 | 1,454,238 |
| 2022 | 1,475,931 |
| 2023 | 1,502,711 |
| 2024 | 1,526,656 |
Growth has been consistent — no single boom year, just steady annual gains of 15,000 to 27,000 people. That kind of sustained inflow keeps demand for housing from collapsing, even as prices soften.
How does San Antonio compare to other Texas cities?
| City | 2024 Population | 4-Year Growth |
|---|---|---|
| Houston | 2,390,125 | 4.0% |
| San Antonio | 1,526,656 | 6.1% |
| Fort Worth | 1,008,106 | 9.1% |
| Austin | 993,588 | 2.9% |
| Arlington | 403,672 | 2.4% |
| Lubbock | 272,086 | 5.4% |
Fort Worth leads the pack at 9.1% growth. San Antonio’s 6.1% outpaces both Houston and Austin. That’s notable — Austin’s growth has slowed to 2.9%, well below its reputation as Texas’s boomtown.
More people means more housing demand. Even with prices declining, the population trend puts a floor under how far values are likely to fall.
San Antonio Housing Market Trends
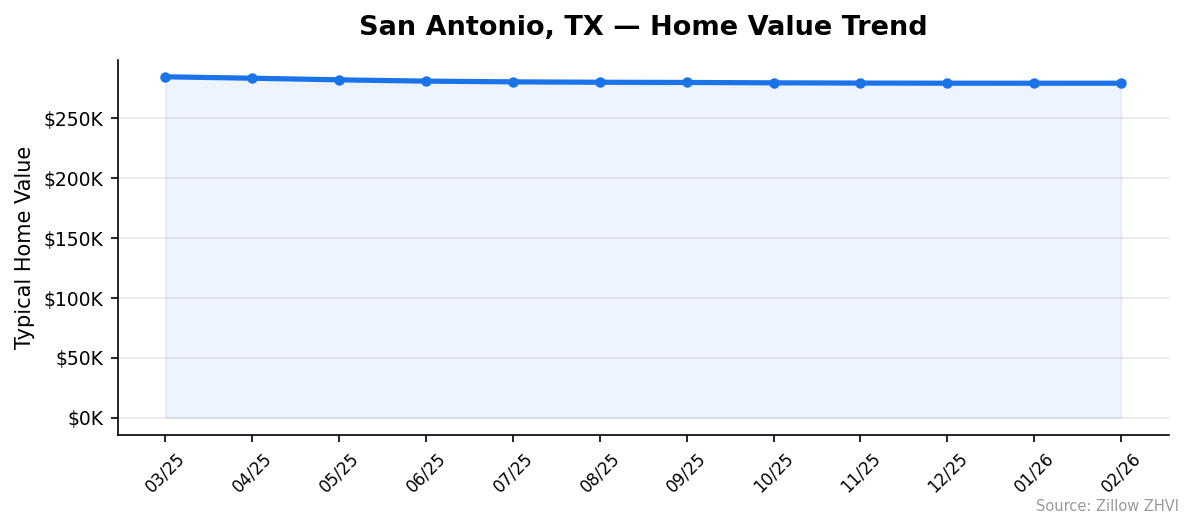
The 12-month trend shows a slow, consistent decline. Prices peaked in March 2025 at $284,562 and have slipped every month since.
| Month | Median Home Value |
|---|---|
| March 2025 | $284,562 |
| April 2025 | $283,373 |
| May 2025 | $282,013 |
| June 2025 | $280,935 |
| July 2025 | $280,327 |
| August 2025 | $279,997 |
| September 2025 | $279,827 |
| October 2025 | $279,505 |
| November 2025 | $279,322 |
| December 2025 | $279,219 |
| January 2026 | $279,179 |
| February 2026 | $279,198 |
The pace of decline is slowing. Between March and June 2025, the median dropped about $3,600. Between December 2025 and February 2026, it barely moved — just $21 in either direction. February actually ticked up $19 from January, the first month-over-month increase in the dataset.
That flattening pattern matters. The market isn’t in freefall. It’s grinding toward a bottom.
Is San Antonio a Good Place to Buy in 2026?
The data leans in favor of buyers right now.
Prices are down 1.9% year over year. They’ve been declining for 11 consecutive months before essentially flatlining in early 2026. That gives you negotiating room that didn’t exist two years ago.
San Antonio’s median of $279,198 remains accessible compared to Austin ($993K+ population competing for housing) and the broader Texas market. You can still find homes under $155,000 in ten ZIP codes. Even in mid-tier neighborhoods, the $240K–$300K range covers a large portion of the city.
The population growth of 6.1% over four years signals sustained demand. You’re buying in a city that’s still adding residents, which supports long-term value even during short-term dips.
The risk? Prices could keep sliding. But the rate of decline has compressed to near zero over the last three months. If you’re buying to live in the home for five or more years, the current entry point is defensible.
San Antonio Housing Market Outlook for 2026-2027
The three-month trend from December 2025 to February 2026 shows the market has effectively flatlined. Values moved less than $50 total across that period.
If the current pace continues, San Antonio home prices are likely to stabilize through mid-2026 rather than decline further. The February uptick — small as it is — broke an 11-month streak of monthly drops.
The 12-month trend suggests prices could settle in the $278K–$280K range for the near term. A significant rebound would require either a drop in mortgage rates or a surge in demand, neither of which is visible in this data alone.
For the remainder of 2026 and into 2027, expect a flat to slightly soft market. The steep declines are behind us. The recovery hasn’t started yet. You’re looking at a market in transition between the two.
Frequently Asked Questions
What is the average home price in San Antonio?
The average home price in San Antonio is $279,198 as of February 2026. This represents the typical home value across 56 ZIP codes in the San Antonio-New Braunfels metro area. Prices range from $108,729 in the most affordable areas to $912,768 at the top end.
Are home prices going up or down in San Antonio?
Prices are going down. The median home value dropped 1.9% year over year, declining from $284,562 in March 2025 to $279,198 in February 2026. However, the rate of decline has slowed sharply, and February 2026 showed a slight $19 increase over January — the first monthly uptick in nearly a year.
Is it cheaper to rent or buy in San Antonio?
Renting is generally cheaper on a monthly basis. Typical rents in most ZIP codes fall between $1,100 and $1,700, while a mortgage on the median-priced home at 7% with 20% down runs about $1,486 before taxes and insurance. Once you factor in property taxes and insurance, buying costs more per month in most neighborhoods.
What is the most affordable neighborhood in San Antonio?
ZIP code 78207 is the most affordable, with a typical home value of $108,729. Other affordable areas include 78225 ($121,131), 78237 ($123,681), and 78211 ($127,369). These neighborhoods are concentrated on the south and west sides of the city.
Methodology
Home values are based on the Zillow Home Value Index (ZHVI), a smoothed measure of typical home values in the 35th to 65th percentile range. Rent estimates use the Zillow Observed Rent Index (ZORI). Population figures come from the U.S. Census Bureau Population Estimates Program (2020–2024 vintage). All datasets are publicly available. Housing data updated 2026-02-28.