Average Home Price in Chicago (2026): Trends, Rents & Data
$316,947. That’s what a typical home costs in Chicago right now. Prices are up 1.9% from a year ago, and the trend line has pointed upward for eight straight months. Across 56 ZIP codes, you’ll find homes as low as $115,670 and as high as $620,271.
Quick answer: The average home price in Chicago, IL is $316,947 as of February 2026, up 1.9% year over year according to Zillow.
Current Home Prices in Chicago
Here’s where the Chicago market stands as of February 2026:
| Metric | Value |
|---|---|
| Median Home Value | $316,947 |
| Year-over-Year Change | +1.9% |
| Lowest ZIP Code Value | $115,670 |
| Highest ZIP Code Value | $620,271 |
| Number of ZIP Codes Tracked | 56 |
| Data as of | February 2026 |
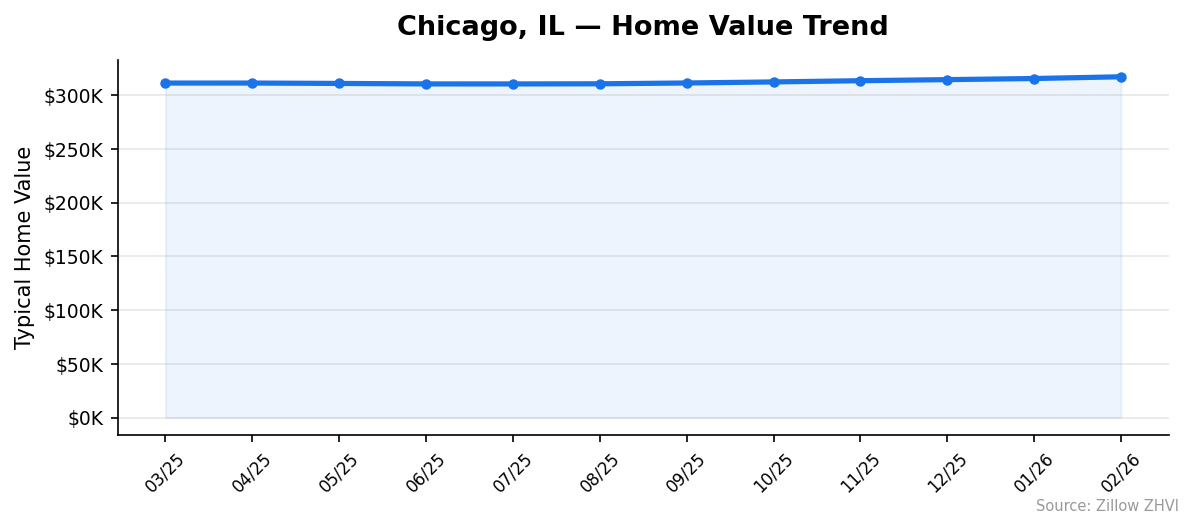
A 1.9% annual gain is modest. It barely keeps pace with inflation. But look at the direction: the median climbed from $311,108 in March 2025 to $316,947 in February 2026. The increases have been steady, not volatile.
The gap between the cheapest and most expensive neighborhoods is striking. A home in the priciest ZIP costs more than five times what you’d pay in the most affordable one. That $504,601 spread means “Chicago home prices” is almost meaningless without specifying where in the city you’re looking.
For buyers watching the market, the takeaway is simple. Chicago isn’t surging. It’s not collapsing. It’s grinding upward at a slow, consistent pace.
Chicago Home Prices by Neighborhood
Chicago’s 56 tracked ZIP codes tell very different stories. Here’s the full breakdown:
| ZIP Code | Median Home Value | Typical Rent |
|---|---|---|
| 60601 | $349,856 | $2,841 |
| 60602 | $246,239 | $2,443 |
| 60603 | $297,406 | $2,325 |
| 60604 | $309,355 | Data not available |
| 60605 | $352,529 | $2,658 |
| 60606 | $300,903 | $2,626 |
| 60607 | $397,206 | $2,885 |
| 60608 | $345,520 | $1,826 |
| 60609 | $242,568 | $1,598 |
| 60610 | $372,289 | $2,699 |
| 60611 | $345,086 | $2,806 |
| 60612 | $347,004 | $2,358 |
| 60613 | $323,575 | $2,217 |
| 60614 | $620,271 | $2,719 |
| 60615 | $246,915 | $1,943 |
| 60616 | $331,244 | $1,738 |
| 60617 | $169,607 | $1,526 |
| 60618 | $538,451 | $2,108 |
| 60619 | $160,970 | $1,458 |
| 60620 | $176,838 | $1,478 |
| 60621 | $115,670 | $1,676 |
| 60622 | $605,556 | $2,482 |
| 60623 | $207,150 | $1,483 |
| 60624 | $205,426 | $1,536 |
| 60625 | $390,184 | $1,898 |
| 60626 | $244,951 | $1,786 |
| 60628 | $144,375 | $1,496 |
| 60629 | $257,447 | $1,408 |
| 60630 | $392,542 | $1,801 |
| 60631 | $432,200 | $2,112 |
| 60632 | $268,190 | $1,432 |
| 60633 | $182,675 | Data not available |
| 60634 | $356,964 | $1,817 |
| 60636 | $128,076 | $1,678 |
| 60637 | $224,341 | $1,790 |
| 60638 | $308,424 | $1,806 |
| 60639 | $313,648 | $1,617 |
| 60640 | $334,124 | $1,903 |
| 60641 | $389,147 | $1,705 |
| 60642 | $536,187 | $2,644 |
| 60643 | $220,069 | $2,386 |
| 60644 | $205,394 | $1,453 |
| 60645 | $293,003 | $1,808 |
| 60646 | $521,323 | $1,550 |
| 60647 | $535,263 | $2,310 |
| 60649 | $138,247 | $1,390 |
| 60651 | $263,354 | $1,634 |
| 60652 | $258,460 | Data not available |
| 60653 | $318,812 | $2,069 |
| 60654 | $360,648 | $2,925 |
| 60655 | $314,022 | Data not available |
| 60656 | $362,082 | $1,640 |
| 60657 | $489,216 | $2,286 |
| 60659 | $345,682 | $1,781 |
| 60660 | $281,805 | $1,756 |
| 60661 | $330,544 | $2,625 |
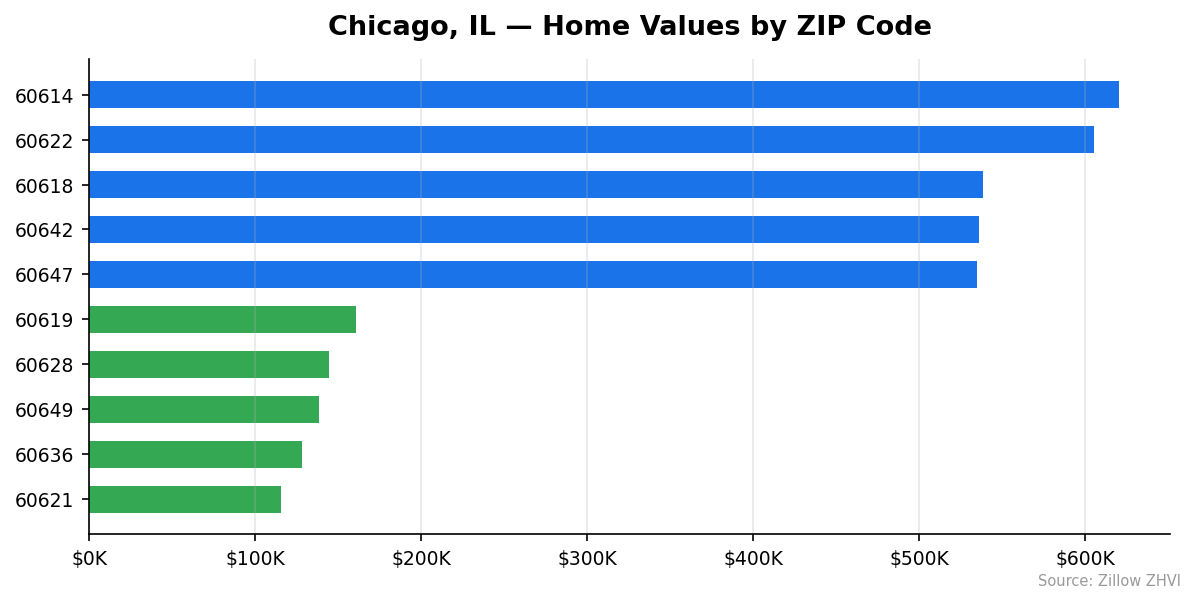
Most Expensive Neighborhoods
60614 (Lincoln Park) — $620,271. The most expensive ZIP in Chicago, nearly double the city median. Rents here run $2,719/month, which is high but not the highest — a sign that home values reflect owner-occupier demand, not just rental yields.
60622 (Wicker Park/Bucktown) — $605,556. Just behind Lincoln Park, this area commands prices 91% above the citywide median. Rents average $2,482/month.
60618 (North Center/Avondale) — $538,451. The third priciest ZIP with rents at a more moderate $2,108/month. The gap between home values and rents here is among the widest in the city.
Most Affordable Neighborhoods
60621 (Englewood) — $115,670. The lowest-priced ZIP in Chicago, 63% below the median. Rents at $1,676/month actually produce a high yield relative to the purchase price.
60636 (West Englewood) — $128,076. Homes here cost 60% less than the citywide median while rents run $1,678/month — nearly identical to neighboring 60621.
60649 (South Shore) — $138,247. The third most affordable ZIP at 56% below median. Rents are the lowest in the city at $1,390/month.
Rent vs Buy in Chicago
Rents across Chicago range from $1,390/month in South Shore (60649) to $2,925/month in River North (60654). That’s a $1,535 spread.
Here’s how the most and least expensive areas compare:
| ZIP Code | Home Value | Monthly Rent | Price-to-Rent Ratio |
|---|---|---|---|
| 60614 | $620,271 | $2,719 | 19.0 |
| 60622 | $605,556 | $2,482 | 20.3 |
| 60654 | $360,648 | $2,925 | 10.3 |
| 60621 | $115,670 | $1,676 | 5.7 |
| 60636 | $128,076 | $1,678 | 6.4 |
| 60649 | $138,247 | $1,390 | 8.3 |
The price-to-rent ratio tells you how many years of rent equals the purchase price. Lower ratios favor buying. In Englewood (60621), you’d recoup the home price in under 6 years of equivalent rent. In Wicker Park (60622), it would take over 20 years.
River North (60654) is an outlier — a relatively moderate home value of $360,648 paired with the city’s highest rent at $2,925. That 10.3 ratio makes it one of the better buy-vs-rent plays in the city.
On the North Side, neighborhoods like 60646 stand out: home values of $521,323 but rents of only $1,550/month. That’s a ratio of 28 — heavily favoring renting over buying.
Your decision depends on where you want to live. The South and West Sides lean toward buying. The North Side and downtown lean toward renting — unless you plan to stay long enough for appreciation to close the gap.
Population Growth and Migration
Chicago lost residents over the past four years, but the bleeding has mostly stopped.
| Year | Population | Change |
|---|---|---|
| 2020 | 2,745,196 | — |
| 2021 | 2,706,324 | -38,872 |
| 2022 | 2,684,076 | -22,248 |
| 2023 | 2,699,144 | +15,068 |
| 2024 | 2,721,308 | +22,164 |
The city dropped from 2,745,196 in 2020 to a low of 2,684,076 in 2022 — a loss of 61,120 people. Since then, it’s recovered about 37,232 residents. The net result: a 0.9% decline over the full four-year window.
Compare that to nearby Illinois cities:
| City | 2024 Population | 4-Year Growth |
|---|---|---|
| Chicago | 2,721,308 | -0.9% |
| Champaign | 91,961 | +4.0% |
| Naperville | 153,124 | +2.5% |
| Joliet | 151,837 | +1.0% |
| Aurora | 180,710 | +0.2% |
| Elgin | 114,701 | 0.0% |
Smaller cities in Illinois are growing while Chicago shrinks, though the gap is narrowing. The 2023-2024 rebound of 22,164 residents is the strongest single-year gain in this dataset.
For housing, the population recovery supports demand. More people means more buyers competing for the same housing stock. But Chicago still has fewer residents than it did in 2020, which limits how much upward pressure population alone can put on prices.
Chicago Housing Market Trends
The 12-month trend shows a clear pattern: prices bottomed out mid-2025 and have climbed since.
| Month | Median Value | Month-over-Month |
|---|---|---|
| March 2025 | $311,108 | — |
| April 2025 | $311,126 | +$18 |
| May 2025 | $310,765 | -$361 |
| June 2025 | $310,317 | -$448 |
| July 2025 | $310,296 | -$21 |
| August 2025 | $310,424 | +$128 |
| September 2025 | $311,186 | +$762 |
| October 2025 | $312,163 | +$977 |
| November 2025 | $313,306 | +$1,143 |
| December 2025 | $314,305 | +$999 |
| January 2026 | $315,337 | +$1,032 |
| February 2026 | $316,947 | +$1,610 |
The inflection point was July 2025. The median hit $310,296 — the lowest point in the 12-month window — and has risen every month since. The most recent month-over-month gain of $1,610 is the largest in the dataset.
From July 2025 through February 2026, the median gained $6,651. That’s a 2.1% increase in seven months. The pace is accelerating: gains in the last three months ($999, $1,032, $1,610) are larger than gains in the three months before that ($762, $977, $1,143).
Is Chicago a Good Place to Buy in 2026?
The data points to a stable, slowly appreciating market. A 1.9% annual gain won’t make anyone rich, but it also means you’re unlikely to buy at a peak and watch your equity evaporate.
Chicago’s price-to-rent ratios vary wildly by neighborhood. If you’re buying on the South Side, the math strongly favors ownership over renting. On the North Side, you need to plan for a longer hold to break even against renting.
The population trend is encouraging. After two years of losses, Chicago added residents in both 2023 and 2024. More people means more demand.
The $316,947 median sits well below the asking prices of peer cities like New York, Los Angeles, or San Francisco. For a major metro of 2.7 million people, Chicago remains relatively accessible.
Risks? The gains are small. If mortgage rates rise further, that 1.9% appreciation could easily get eaten by higher borrowing costs. And the city’s long-term population trajectory, while improving, is still net negative since 2020.
Chicago Housing Market Outlook for 2026-2027
The three-month acceleration is hard to ignore. Monthly gains went from $999 in December to $1,032 in January to $1,610 in February. If that pace continues through spring — historically the strongest buying season — the median could push past $320,000 by mid-2026.
The seven-month streak of consecutive gains suggests underlying demand, not a seasonal blip. Prices bottomed in July 2025, recovered through winter (typically a slow season), and are now entering spring with momentum.
If the current trend holds, a full-year 2026 gain in the 2-3% range is plausible. Nothing dramatic. But steady appreciation with accelerating monthly gains is a healthier signal than a sharp spike followed by a correction.
Similar Markets in IL
If you’re exploring the Chicago metro or elsewhere in Illinois, these markets offer different price points:
- Aurora — A western suburb with a population of 180,710, offering lower price points than the city proper.
- Naperville — One of the fastest-growing cities in Illinois at 2.5% population growth, with 153,124 residents.
- Joliet — A growing southwest suburb with 151,837 residents and steady 1.0% population gains.
- Elgin — A northwest suburb with a flat population of 114,701, potentially offering stable pricing.
- Evanston — Chicago’s immediate northern neighbor, popular with buyers who want proximity without city taxes.
Frequently Asked Questions
What is the average home price in Chicago?
The average home price in Chicago is $316,947 as of February 2026. That figure represents the citywide median across 56 tracked ZIP codes. Individual neighborhoods range from $115,670 in Englewood (60621) to $620,271 in Lincoln Park (60614).
Are home prices going up or down in Chicago?
Prices are going up. The median rose 1.9% year over year, and monthly gains have accelerated since July 2025. The most recent month-over-month increase of $1,610 (January to February 2026) was the largest in the past 12 months.
Is it cheaper to rent or buy in Chicago?
It depends on the neighborhood. In affordable South Side ZIPs like 60621, the price-to-rent ratio is under 6 — strongly favoring buying. In expensive North Side areas like 60622, the ratio exceeds 20, making renting the better short-term financial play. Citywide rents range from $1,390 to $2,925 per month.
What is the most affordable neighborhood in Chicago?
ZIP code 60621 (Englewood) has the lowest typical home value at $115,670 — 63% below the citywide median. Nearby 60636 (West Englewood) at $128,076 and 60649 (South Shore) at $138,247 are also well below $150,000.
Methodology
Home values are based on the Zillow Home Value Index (ZHVI), a smoothed measure of typical home values in the 35th to 65th percentile range. Rent estimates use the Zillow Observed Rent Index (ZORI). Population figures come from the U.S. Census Bureau Population Estimates Program (2020-2024 vintage). All datasets are publicly available. Housing data updated 2026-02-28.