Naperville Home Prices: $581K, Up 4.4% — 4 ZIPs Analyzed (2026)
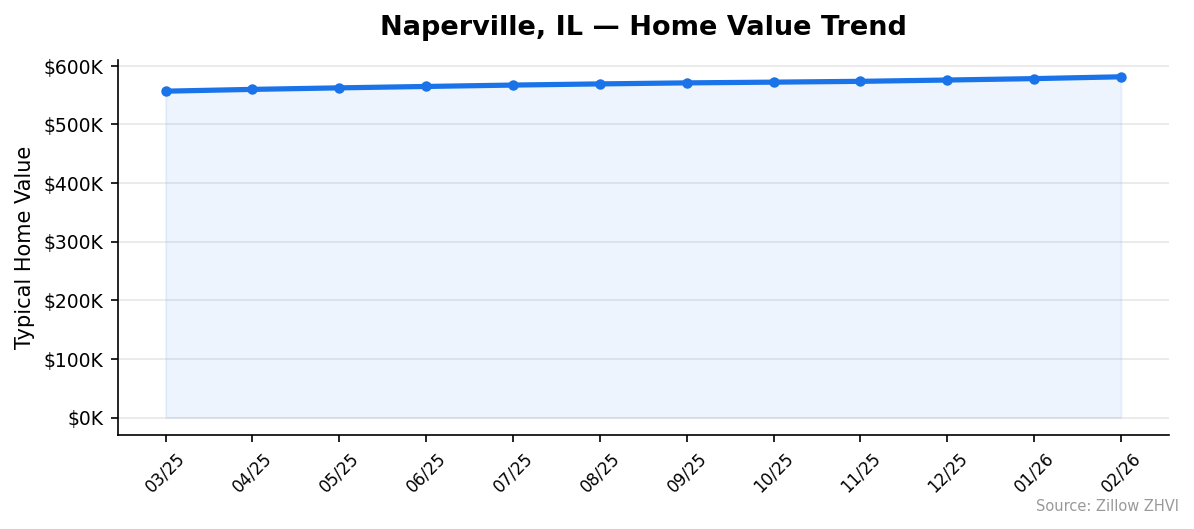
$581,199. That’s the median home value in Naperville, IL as of February 2026, according to the Zillow Home Value Index. Prices climbed 4.4% over the past year, and every month in the 12-month trend shows a higher number than the one before.
Quick answer: The average home price in Naperville, IL is $581,199 as of February 2026, up 4.4% year over year according to Zillow.
Current Home Prices in Naperville
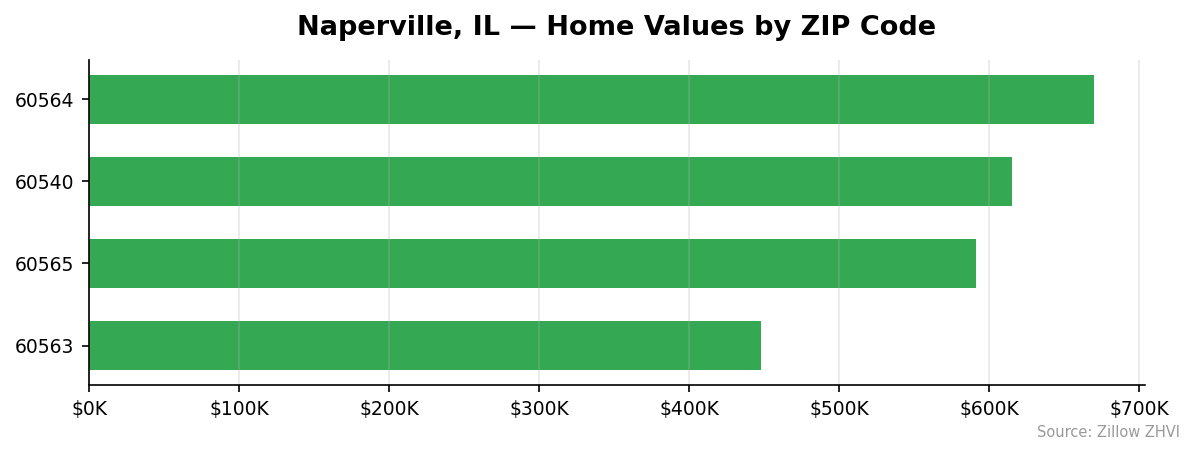
Naperville sits in the Chicago-Naperville-Elgin metro and tracks well above the Illinois median. The data covers four ZIP codes inside the city, with values spanning from the mid-$400Ks to the high $600Ks.
| Metric | Value |
|---|---|
| Median home value | $581,199 |
| Year-over-year change | +4.4% |
| Lowest ZIP median | $448,162 |
| Highest ZIP median | $670,193 |
| ZIP codes tracked | 4 |
| Data month | February 2026 |
The 4.4% gain outpaces the national pace measured by the same index. Annual appreciation of that size adds roughly $24,500 to the typical Naperville home over a single year.
Price spread matters here. The gap between the cheapest and most expensive ZIP is $222,031 — a 49% premium from the bottom to the top. You are not buying into one price tier in Naperville. You are choosing among four distinct ones.
Illinois has high property taxes, and DuPage County rates typically run near 2% of assessed value. On a $581,199 home, that works out to roughly $11,600 per year before any exemptions. Factor that in when you compare Naperville to markets in lower-tax states.
Naperville Home Prices by Neighborhood
Here is the full ZIP-level breakdown.
| ZIP Code | Median Value | Monthly Rent | Vs. City Median |
|---|---|---|---|
| 60564 | $670,193 | $2,459 | +15.3% |
| 60540 | $615,072 | $2,224 | +5.8% |
| 60565 | $591,367 | $2,049 | +1.7% |
| 60563 | $448,162 | $2,095 | −22.9% |
Most Expensive
- 60564 at $670,193 — the priciest ZIP in the city, about 15% above the Naperville median and commanding the highest rent at $2,459 per month.
- 60540 at $615,072 — the downtown area sits roughly 6% over the city median and rents for $2,224 per month.
- 60565 at $591,367 — a slight premium to the city median with the lowest rent-to-value ratio of the four ZIPs.
Most Affordable
- 60563 at $448,162 — the only ZIP below the city median, priced roughly 23% cheaper than the citywide number.
- 60565 at $591,367 — middle of the pack, offering a rent of $2,049, the lowest monthly rent in the city.
- 60540 at $615,072 — affordability is relative here. This is the second-most expensive ZIP but still $55K below the top tier.
An interesting detail: rent in 60563 ($2,095) runs higher than rent in 60565 ($2,049) even though 60563’s home values are $143K lower. Rents do not always follow purchase prices in small-sample ZIPs.
Rent vs Buy in Naperville
The average ZIP-level rent across Naperville is about $2,207 per month. Compare that against the cost of owning the median home.
| Cost | Rent | Buy (median $581,199) |
|---|---|---|
| Monthly housing cost | ~$2,207 | ~$3,090 P&I + ~$970 taxes + ~$160 insurance |
| Estimated total | ~$2,207 | ~$4,220 |
The buy math assumes 20% down ($116,240), a 30-year fixed mortgage near 7%, and DuPage County property taxes near 2% of value. The owned monthly cost runs roughly $2,000 higher than rent, before you count maintenance, HOA fees, or closing costs.
Break-even changes that picture. If home values keep gaining 4.4% a year, a Naperville home appreciates about $2,130 per month. That offsets most of the monthly cost gap on paper — but only if you plan to hold long enough to cover transaction costs and only if prices keep rising.
Rent runs the tightest in 60565 at $2,049 and the highest in 60564 at $2,459. Renters chasing value tend to look inside 60565. Buyers chasing price look inside 60563.
Population Growth and Migration
Naperville is adding residents at a steady clip. The city grew 2.5% between 2020 and 2024, reaching 153,124 people.
| Year | Population |
|---|---|
| 2020 | 149,434 |
| 2021 | 149,535 |
| 2022 | 150,355 |
| 2023 | 151,166 |
| 2024 | 153,124 |
Growth accelerated between 2023 and 2024, with the city adding nearly 2,000 residents in a single year — more than the previous three years combined.
Here is how Naperville stacks up against other Illinois cities.
| City | 2024 Population | 4-Year Growth |
|---|---|---|
| Naperville | 153,124 | +2.5% |
| Champaign | 91,961 | +4.0% |
| Joliet | 151,837 | +1.0% |
| Aurora | 180,710 | +0.2% |
| Elgin | 114,701 | 0.0% |
| Waukegan | 88,570 | −0.6% |
Naperville outpaces every nearby peer except Champaign, a college town with different demand drivers. Aurora and Elgin — both closer to Naperville in character — are essentially flat. Waukegan is losing residents.
A growing population plus a limited ZIP footprint (just four) plus rising prices suggests tight supply relative to demand. That helps explain why Naperville’s 4.4% annual appreciation runs ahead of slower-growing Illinois cities.
Naperville Housing Market Trends
Prices climbed every single month for the past year. No dips. No pauses.
| Month | Median Value | Monthly Change |
|---|---|---|
| Mar 2025 | $556,665 | — |
| Apr 2025 | $559,725 | +0.55% |
| May 2025 | $562,321 | +0.46% |
| Jun 2025 | $564,711 | +0.43% |
| Jul 2025 | $567,077 | +0.42% |
| Aug 2025 | $569,056 | +0.35% |
| Sep 2025 | $570,823 | +0.31% |
| Oct 2025 | $572,059 | +0.22% |
| Nov 2025 | $573,446 | +0.24% |
| Dec 2025 | $575,675 | +0.39% |
| Jan 2026 | $578,067 | +0.42% |
| Feb 2026 | $581,199 | +0.54% |
The total 12-month gain works out to $24,534. Monthly increases softened during the fall — October’s 0.22% was the smallest — then picked back up into winter. February’s +0.54% was the strongest single-month gain since April 2025.
The pace is not slowing. If anything, the past three months show renewed momentum.
Is Naperville a Good Place to Buy in 2026?
The numbers point to a seller’s market. Prices are rising every month, population is growing, and the gap between rent and buy favors landlords over new buyers on cash flow alone.
Three things argue for buying anyway:
- Consistent appreciation. Twelve straight months of gains, with no monthly decline anywhere in the data.
- Demographic tailwind. The 2023-to-2024 population jump of nearly 2,000 residents points to continued demand.
- ZIP-level choice. If $670K in 60564 is out of reach, 60563 offers a $448K entry point in the same city.
Three things argue against:
- Monthly carrying cost. Buying the median home runs roughly $2,000 more per month than renting.
- Property tax drag. Illinois property taxes cut into appreciation gains more than in most states.
- Rate sensitivity. With monthly gains already softening in late 2025 before re-accelerating, the market is not immune to pressure.
If you plan to stay 7+ years, the math tends to favor buying. For shorter holds, the break-even gets harder.
Naperville Housing Market Outlook for 2026-2027
The 3-month trend points up. Between December 2025 and February 2026, prices rose 0.96% — faster than the 0.77% gain from September to November. The market is heating, not cooling.
If the current pace continues, Naperville’s median would sit meaningfully higher by late 2026. Whether that holds depends on factors outside the dataset: interest rates, broader Chicago metro demand, and Illinois tax policy.
What the data does show: no month-over-month decline in the past year, growing population, and a tight ZIP count that limits new supply absorption. Those three factors together typically support continued price firmness over the next 3 to 6 months.
Watch the monthly change percentage. If it drops below 0.20% or turns negative, that signals cooling. February’s 0.54% is nowhere near that threshold.
Similar Markets in IL
- Aurora — the neighboring city offers a different price tier with much slower population growth.
- Chicago — the metro anchor with deeper ZIP coverage and different dynamics than the suburban Naperville market.
- Joliet — another near-Naperville option with similar 2024 population size but weaker growth.
- Schaumburg — a comparable affluent suburb in the Chicago metro.
- Evanston — a North Shore alternative for buyers weighing suburban Chicago options.
Frequently Asked Questions
What is the average home price in Naperville?
The median home value in Naperville, IL is $581,199 as of February 2026. That figure represents typical homes in the 35th to 65th percentile of the market across all four tracked ZIP codes.
Are home prices going up or down in Naperville?
Prices are up 4.4% year over year. Every month in the past 12-month trend shows a higher median than the one before, and the most recent monthly gain of 0.54% was the largest since April 2025.
Is it cheaper to rent or buy in Naperville?
Renting is cheaper month to month. The average ZIP-level rent runs about $2,207, while the total monthly cost of owning the median home — principal, interest, DuPage County taxes, and insurance — lands near $4,220 on a 20% down payment at current rates.
What is the most affordable neighborhood in Naperville?
ZIP 60563 is the most affordable, with a median home value of $448,162. That is roughly 23% below the citywide median of $581,199 and $222,031 cheaper than the most expensive ZIP, 60564.
Methodology
Home values are based on the Zillow Home Value Index (ZHVI), a smoothed measure of typical home values in the 35th to 65th percentile range. Rent estimates use the Zillow Observed Rent Index (ZORI). Population figures come from the U.S. Census Bureau Population Estimates Program (2020-2024 vintage). All datasets are publicly available. Housing data updated 2026-02-28.