Average Home Price in El Paso TX (2026): Trends, Rents & ZIP Data
$235,571. That’s what a typical home costs in El Paso right now — and prices are still climbing. The median is up 1.1% from a year ago, a slow but steady rise that has held for months.
Quick answer: The average home price in El Paso, TX is $235,571 as of February 2026, up 1.1% year over year according to Zillow.
Current Home Prices in El Paso
El Paso remains one of the more affordable major cities in Texas. Here’s the snapshot as of February 2026:
| Metric | Value |
|---|---|
| Median Home Value | $235,571 |
| Year-over-Year Change | +1.1% |
| Lowest ZIP Median | $132,665 |
| Highest ZIP Median | $405,451 |
| Number of ZIP Codes | 18 |
The $235,571 median puts El Paso well below the statewide average for Texas metros. The gap between the cheapest and most expensive neighborhoods is wide — about $273,000 separates the bottom from the top.
Price growth has been modest. A 1.1% annual gain means a home worth $233,000 last March is worth roughly $2,500 more today. Not the kind of appreciation that builds wealth fast, but also not the kind of decline that puts homeowners underwater.
For buyers, this stability is worth noting. You’re not chasing a market that’s running away from you. Monthly increases have been small — $978 from January to February — and the trend line has been flat-to-slightly-up for the past year.
El Paso Home Prices by Neighborhood
Prices vary sharply across El Paso’s 18 ZIP codes. The table below shows every tracked neighborhood:
| ZIP Code | Median Home Value | Median Rent |
|---|---|---|
| 79901 | $132,665 | N/A |
| 79902 | $276,138 | $1,117 |
| 79903 | $172,979 | $1,049 |
| 79904 | $184,009 | $993 |
| 79905 | $155,792 | $1,199 |
| 79907 | $173,509 | $1,299 |
| 79911 | $388,831 | $2,499 |
| 79912 | $311,477 | $1,404 |
| 79915 | $165,808 | $1,032 |
| 79922 | $405,451 | N/A |
| 79924 | $190,937 | $1,414 |
| 79925 | $232,832 | $1,561 |
| 79930 | $178,523 | $1,245 |
| 79932 | $316,839 | $1,743 |
| 79934 | $248,766 | $1,749 |
| 79935 | $236,593 | $1,050 |
| 79936 | $218,608 | $1,447 |
| 79938 | $250,515 | $1,682 |
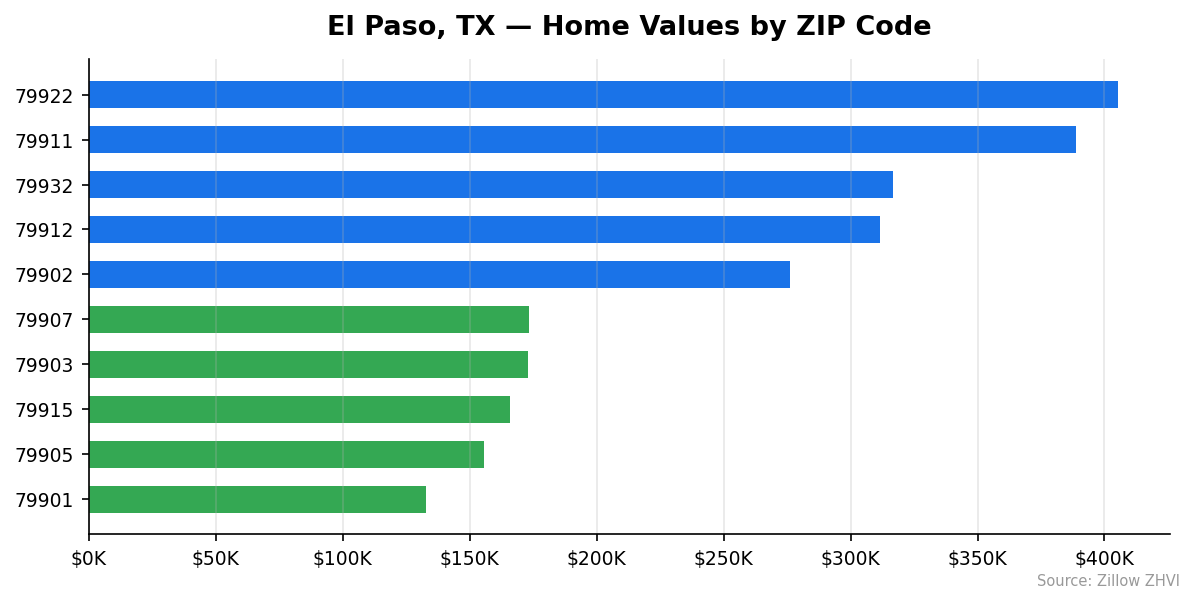
Most Expensive ZIP Codes
79922 leads the city at $405,451 — 72% above the citywide median. Rent data isn’t available for this area, but the home values suggest established, higher-end housing stock.
79911 comes in at $388,831 with the highest rents in the city at $2,499/month. That rent-to-price ratio points to a neighborhood with strong rental demand.
79932 rounds out the top three at $316,839. Rents here are $1,743/month, reflecting its position as an upper-middle-tier market.
Most Affordable ZIP Codes
79901 is the cheapest area in El Paso at $132,665 — almost half the city median. No rent data is available for this downtown-adjacent ZIP.
79905 sits at $155,792 with rents of $1,199/month. Buyers here pay about 34% less than the citywide average.
79915 comes in at $165,808 with rents at $1,032/month — some of the lowest in the city, making it a budget-friendly option for both renters and buyers.
Rent vs Buy in El Paso
El Paso’s rent-versus-buy math depends heavily on your neighborhood. Across the 16 ZIP codes with rent data, the average monthly rent is approximately $1,405.
Here’s how the numbers stack up for a buyer at the citywide median of $235,571:
| Scenario | Monthly Cost |
|---|---|
| Median Rent (citywide avg) | ~$1,405 |
| Mortgage Payment (20% down, 7%, 30-yr) | ~$1,254 |
| Mortgage + Taxes & Insurance (est.) | ~$1,650 |
The raw mortgage payment on a $188,457 loan at 7% runs about $1,254 per month. Add property taxes and insurance, and you’re closer to $1,650. That’s roughly $245 more per month than renting.
But the picture shifts in cheaper neighborhoods. In 79904, rents average $993/month — buying a $184,009 home there could cost roughly the same after the down payment math. In 79911, rents hit $2,499 while home values sit at $388,831, making a purchase potentially more attractive for those who can afford the entry price.
The short answer: renting is cheaper month-to-month for most El Paso households. But with 1.1% annual appreciation and equity building, buying makes sense if you plan to stay at least 5 years.
Population Growth and Migration
El Paso’s population has been nearly flat. The city reached 681,723 residents in 2024, up just 0.3% from 679,382 in 2020. That works out to about 2,341 additional people over four years.
| Year | Population |
|---|---|
| 2020 | 679,382 |
| 2021 | 678,546 |
| 2022 | 679,247 |
| 2023 | 681,573 |
| 2024 | 681,723 |
The city actually lost residents in 2021 before slowly recovering. Growth has been positive since 2022, but barely.
Compare that to other Texas cities:
| City | 2024 Population | 4-Year Growth |
|---|---|---|
| Fort Worth | 1,008,106 | +9.1% |
| San Antonio | 1,526,656 | +6.1% |
| Lubbock | 272,086 | +5.4% |
| Houston | 2,390,125 | +4.0% |
| Austin | 993,588 | +2.9% |
| El Paso | 681,723 | +0.3% |
El Paso’s growth rate is the slowest of any major Texas metro listed here. Fort Worth added 9.1% in the same period. This sluggish population growth helps explain why home prices have stayed relatively affordable — demand simply isn’t surging the way it is in DFW or Austin.
For buyers, this is a mixed signal. Low population growth means less competition for homes and more negotiating power. But it also means slower appreciation and weaker resale demand down the road.
El Paso Housing Market Trends
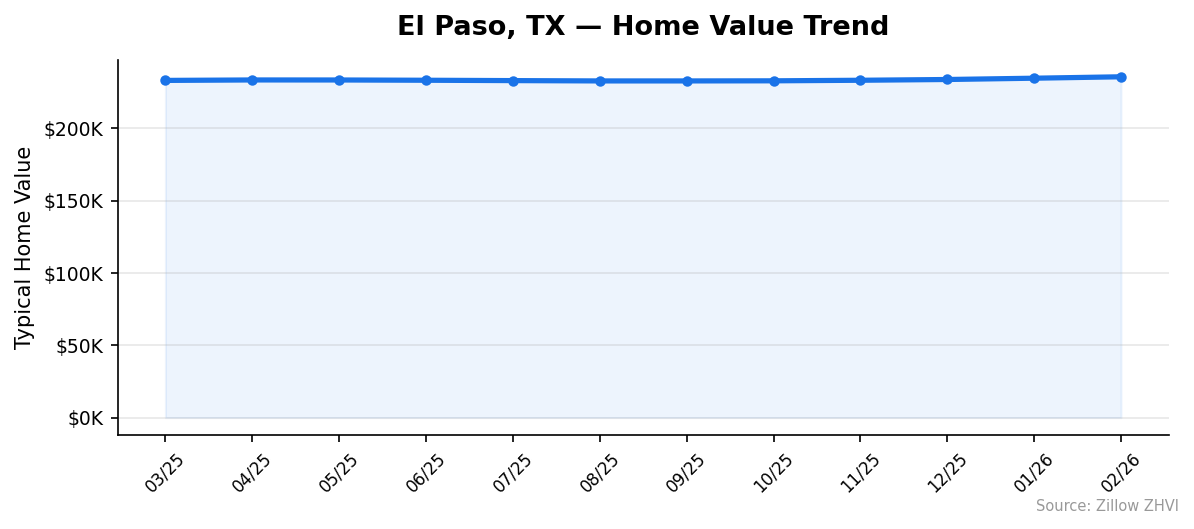
The 12-month trend tells a story of a market that bottomed out in mid-2025 and has been ticking upward since.
| Month | Median Value | Min ZIP | Max ZIP |
|---|---|---|---|
| Mar 2025 | $233,067 | $131,305 | $395,450 |
| Apr 2025 | $233,382 | $131,134 | $397,344 |
| May 2025 | $233,361 | $129,958 | $399,100 |
| Jun 2025 | $233,177 | $128,692 | $399,403 |
| Jul 2025 | $232,935 | $127,579 | $399,309 |
| Aug 2025 | $232,706 | $126,977 | $398,780 |
| Sep 2025 | $232,707 | $126,880 | $399,221 |
| Oct 2025 | $232,785 | $127,500 | $399,475 |
| Nov 2025 | $233,170 | $128,502 | $401,035 |
| Dec 2025 | $233,699 | $129,367 | $402,572 |
| Jan 2026 | $234,593 | $131,003 | $404,456 |
| Feb 2026 | $235,571 | $132,665 | $405,451 |
The median dipped from $233,382 in April 2025 to $232,706 in August — a decline of just $676 over four months. Since then, the recovery has been steady. Every month from September through February posted gains.
Something interesting is happening at the extremes. The most expensive ZIP climbed from $395,450 to $405,451 over the year — a $10,000 gain. The cheapest ZIP moved from $131,305 to $132,665, gaining only $1,360. The gap between top and bottom is widening.
Is El Paso a Good Place to Buy in 2026?
The data points to a balanced market. Prices are rising but not fast — 1.1% annually won’t price you out if you wait a few months. The supply of homes across 18 ZIP codes gives buyers real choices, from $132K starter homes in 79901 to $405K properties in 79922.
El Paso’s biggest selling point is affordability. At $235,571, the median is well below most major Texas cities. If you’re moving from Austin, Dallas, or Houston, your dollar stretches further here.
The risk? Slow population growth. A city that’s barely adding residents won’t see the demand-driven price spikes that build fast equity. If you’re buying as an investment, expect modest returns. If you’re buying a home to live in for 5-10 years, El Paso’s stable prices and low entry point make it a reasonable bet.
Renters spending $1,400/month or more should run the buy-versus-rent math for their specific neighborhood. In several ZIP codes, monthly ownership costs are competitive with rent.
El Paso Housing Market Outlook for 2026-2027
The three-month trend from December through February shows consistent gains: $233,699 → $234,593 → $235,571. That’s an average increase of about $936 per month.
If this pace continues through 2026, the median could reach the $240,000–$243,000 range by year’s end. That would represent roughly 3% annual growth — a slight acceleration from the current 1.1% year-over-year figure.
The more expensive ZIP codes are climbing faster than the affordable ones, which suggests demand is concentrated at the higher end. Don’t expect prices in areas like 79901 or 79905 to move much.
No data suggests a downturn is coming. The market flattened in summer 2025 but never actually declined in a meaningful way. Barring a major economic shock, El Paso looks set for another year of slow, steady price increases.
Similar Markets in TX
If you’re shopping in El Paso, these other Texas markets may interest you:
- Houston — A much larger metro with more inventory and price variety for buyers willing to move east.
- San Antonio — Similar affordability to El Paso with stronger population growth.
- Brownsville — Another border city that tends to run cheaper than El Paso.
- Dallas — Higher prices but stronger job market and appreciation potential.
- Edinburg — A smaller South Texas market worth considering for budget-conscious buyers.
Frequently Asked Questions
What is the average home price in El Paso?
The average home price in El Paso is $235,571 as of February 2026. That’s the median across 18 ZIP codes tracked by Zillow’s Home Value Index. Prices range from $132,665 in the 79901 ZIP code to $405,451 in 79922.
Are home prices going up or down in El Paso?
Home prices are going up. The median increased 1.1% year over year. After a brief plateau in summer 2025, prices have risen every month since September 2025, gaining about $2,900 over the past five months.
Is it cheaper to rent or buy in El Paso?
Renting is generally cheaper on a monthly basis. The average rent across El Paso runs about $1,405/month, while a mortgage on the median-priced home costs approximately $1,650/month including taxes and insurance. However, in lower-cost neighborhoods like 79904, where rents average $993, buying may be comparable or cheaper.
What is the most affordable neighborhood in El Paso?
ZIP code 79901 is the most affordable with a median home value of $132,665. That’s 44% below the citywide median. Other affordable options include 79905 at $155,792 and 79915 at $165,808, where rents are also among the city’s lowest at $1,032/month.
Methodology
Home values are based on the Zillow Home Value Index (ZHVI), a smoothed measure of typical home values in the 35th to 65th percentile range. Rent estimates use the Zillow Observed Rent Index (ZORI). Population figures come from the U.S. Census Bureau Population Estimates Program (2020-2024 vintage). All datasets are publicly available. Housing data updated 2026-02-28.