Brownsville Home Prices: $197K, Up 2.0% — 3 ZIPs Analyzed (2026)
$197,401. That’s what a typical home costs in Brownsville, TX right now. Prices are up 2.0% compared to a year ago, and the city remains one of the most affordable housing markets in Texas.
Quick answer: The average home price in Brownsville, TX is $197,401 as of February 2026, up 2.0% year over year according to Zillow.
Current Home Prices in Brownsville
Brownsville sits well below the Texas state average for home prices. Here’s where the market stands right now.
| Metric | Value |
|---|---|
| Median home value | $197,401 |
| Year-over-year change | +2.0% |
| Lowest ZIP median | $172,556 |
| Highest ZIP median | $231,852 |
| Number of tracked ZIPs | 3 |
| Data as of | February 2026 |
A 2% annual gain is modest. It’s not the kind of surge that prices buyers out overnight, but it does mean your dollar buys slightly less each month. Over the past year, the median home gained roughly $3,900 in value.
The gap between the cheapest and most expensive ZIP codes is about $59,000. That’s a meaningful spread for a city where the median is under $200K. Where you buy within Brownsville matters.
For context, a $197,401 home with 20% down and a 6.5% mortgage rate puts your monthly principal and interest payment around $997. Add taxes and insurance, and you’re looking at roughly $1,200-$1,300 per month total.
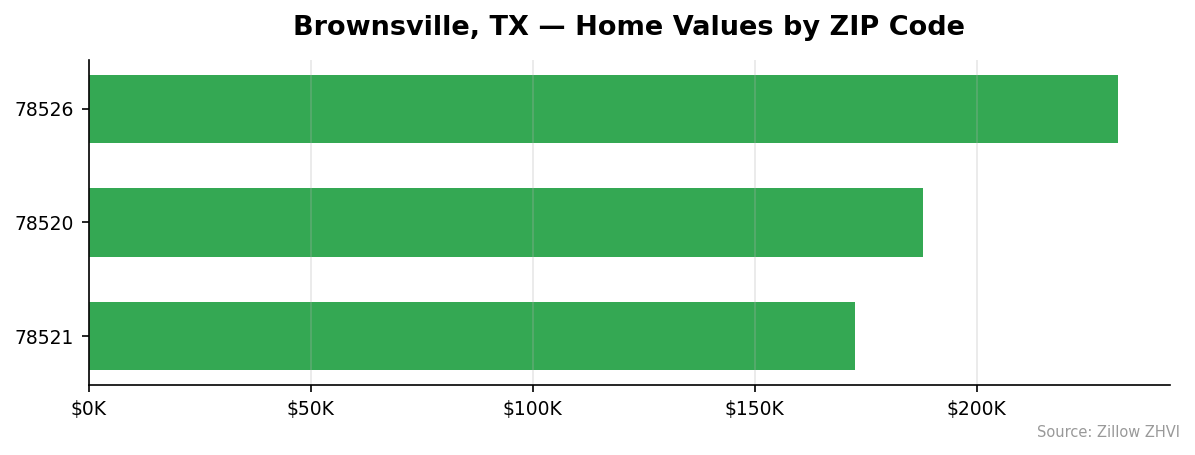
Brownsville Home Prices by Neighborhood
Three ZIP codes cover the Brownsville market, and prices vary significantly across them.
| ZIP Code | Median Home Value | Avg Monthly Rent |
|---|---|---|
| 78521 | $172,556 | $1,345 |
| 78520 | $187,794 | $1,555 |
| 78526 | $231,852 | $1,924 |
Most Expensive
78526 tops the list at $231,852 — about 17% above the city median. Rents here also run the highest at $1,924 per month, suggesting stronger demand and newer housing stock.
Most Affordable
78521 is Brownsville’s budget pick at $172,556, roughly 13% below the city average. Rent here is $1,345 per month, making it the cheapest area to both buy and rent. 78520 falls in the middle at $187,794 with rents of $1,555.
The price difference between the cheapest and priciest ZIP is $59,297. A buyer choosing 78521 over 78526 saves about $375 per month on a mortgage — real money over 30 years.
Rent vs Buy in Brownsville
Brownsville rents range from $1,345 to $1,924 per month depending on the ZIP code.
| ZIP Code | Median Home Value | Monthly Rent | Est. Mortgage Payment* |
|---|---|---|---|
| 78521 | $172,556 | $1,345 | ~$870 |
| 78520 | $187,794 | $1,555 | ~$950 |
| 78526 | $231,852 | $1,924 | ~$1,170 |
*Estimated P&I with 20% down at 6.5%. Does not include taxes/insurance.
In every ZIP code, the base mortgage payment is lower than rent. Even after adding property taxes and insurance — typically $300-$400 per month in Cameron County — buying remains competitive with renting.
The math favors buyers most in 78526, where the rent-to-mortgage gap is widest. You’d pay $1,924 to rent but roughly $1,500-$1,600 to own (including taxes and insurance). That’s $300+ per month in savings, plus you build equity.
The catch: you need roughly $35,000-$46,000 for a 20% down payment, depending on the ZIP. With less money down, PMI narrows the gap.
Population Growth and Migration
Brownsville added over 5,300 residents between 2020 and 2024, a 2.8% increase.
| Year | Population |
|---|---|
| 2020 | 186,648 |
| 2021 | 187,415 |
| 2022 | 189,239 |
| 2023 | 190,572 |
| 2024 | 191,967 |
Growth has been steady — about 1,300 new residents per year. No single year saw a spike or a decline. That consistency matters. It signals sustained demand rather than a one-time boom.
How does Brownsville compare to other Texas cities?
| City | 2024 Population | 4-Year Growth |
|---|---|---|
| Fort Worth | 1,008,106 | 9.1% |
| San Antonio | 1,526,656 | 6.1% |
| Lubbock | 272,086 | 5.4% |
| Houston | 2,390,125 | 4.0% |
| Austin | 993,588 | 2.9% |
| Brownsville | 191,967 | 2.8% |
Brownsville’s growth rate trails most major Texas metros but isn’t far behind Austin. The slower pace partly explains why home prices haven’t surged the way they have in DFW or Austin — less population pressure means less bidding-war heat.
For housing demand, moderate growth is a positive sign. It keeps demand stable without creating the kind of supply crunch that sends prices spiraling.
Brownsville Housing Market Trends
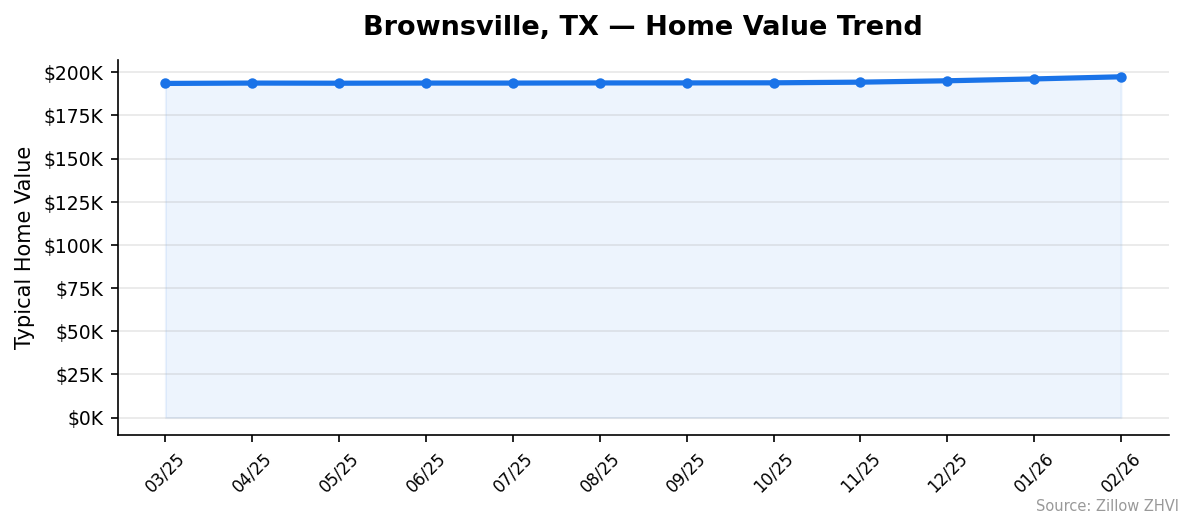
Here’s how home values moved month by month over the past year.
| Month | Median Value | Change from Prior Month |
|---|---|---|
| Mar 2025 | $193,558 | — |
| Apr 2025 | $193,760 | +$202 |
| May 2025 | $193,680 | -$80 |
| Jun 2025 | $193,763 | +$83 |
| Jul 2025 | $193,762 | -$1 |
| Aug 2025 | $193,838 | +$76 |
| Sep 2025 | $193,856 | +$18 |
| Oct 2025 | $193,911 | +$55 |
| Nov 2025 | $194,290 | +$379 |
| Dec 2025 | $195,089 | +$799 |
| Jan 2026 | $196,159 | +$1,070 |
| Feb 2026 | $197,401 | +$1,242 |
The pattern is clear. Prices flatlined from March through October 2025, hovering in a tight $193,500-$193,900 band. Then starting in November, growth accelerated. The last three months each posted larger gains than the one before.
February’s $1,242 monthly increase was the largest of the entire 12-month period. The market has shifted from stagnant to clearly gaining momentum.
Is Brownsville a Good Place to Buy in 2026?
The numbers tell a mixed but mostly positive story.
On the “buy” side: homes are under $200K, mortgage payments undercut rents, population is growing, and price momentum is building. You’re not buying into an overheated market.
On the “wait” side: 2% annual appreciation is modest. You won’t get rich on equity gains alone. And Brownsville’s economy is more dependent on trade and border activity than a diversified metro like Houston or Dallas.
For first-time buyers, Brownsville offers something rare in 2026 — a city where a household earning the area median income can actually afford a home. The barrier to entry is lower than almost anywhere else in Texas.
Investors should note the rent-to-price ratios. In 78521, a $172,556 home renting for $1,345 per month yields a gross rent ratio around 9.3% annually. That’s strong.
Brownsville Housing Market Outlook for 2026-2027
The three-month trend is accelerating: +$799 in December, +$1,070 in January, +$1,242 in February. If that pace continues through spring and summer — historically the strongest buying months — Brownsville could close 2026 above $205,000.
The flat period from April through October 2025 suggests the market has a floor around $193,500. Prices tested that level for six months and never broke below it. That’s a baseline worth watching.
Population growth of 2.8% supports continued, moderate price gains. There’s no sign of a sudden supply glut or demand collapse in the data. Expect steady appreciation in the 2-4% annual range unless interest rates shift dramatically.
Similar Markets in TX
If you’re shopping in Brownsville, these other Texas cities offer different price points.
- Edinburg — Just up the road in the Rio Grande Valley, another affordable border-area market worth comparing.
- El Paso — A larger border city with similar affordability and a different economic base.
- Houston — A major metro with more job diversity but higher prices.
- Katy — A Houston suburb for buyers wanting suburban Texas living at a higher price tier.
- Spring — Another Houston-area option with a different feel and price range.
Frequently Asked Questions
What is the average home price in Brownsville?
The average home price in Brownsville is $197,401 as of February 2026. This represents the typical home value across all three tracked ZIP codes, which range from $172,556 in 78521 to $231,852 in 78526.
Are home prices going up or down in Brownsville?
Prices are going up. Brownsville home values increased 2.0% year over year. The recent trend shows accelerating gains — February 2026 posted the largest single-month increase ($1,242) in at least a year.
Is it cheaper to rent or buy in Brownsville?
Buying tends to be cheaper on a monthly basis. A mortgage on the median home (20% down, 6.5% rate) runs about $997 in principal and interest. Even with taxes and insurance added, total ownership costs are competitive with rents that range from $1,345 to $1,924 per month.
What is the most affordable neighborhood in Brownsville?
ZIP code 78521 is the most affordable with a median home value of $172,556 — about $25,000 below the city average. Rent there is also the lowest at $1,345 per month. It offers the best entry point for budget-conscious buyers.
Methodology
Home values are based on the Zillow Home Value Index (ZHVI), a smoothed measure of typical home values in the 35th to 65th percentile range. Rent estimates use the Zillow Observed Rent Index (ZORI). Population figures come from the U.S. Census Bureau Population Estimates Program (2020-2024 vintage). All datasets are publicly available. Housing data updated 2026-02-28.