Fairfield Home Prices: $1,065K, Up 6.4% — 3 ZIPs Analyzed (2026)
$1,065,388. That’s what a typical Fairfield home is worth as of February 2026, and the number keeps climbing. Values are up 6.4% from a year ago, and they have risen every single month for the past 12 months. Three ZIP codes make up the town, and the gap between cheapest and priciest is wider than $700,000.
Quick answer: The average home price in Fairfield, CT is $1,065,388 as of February 2026, up 6.4% year over year according to Zillow.
Current Home Prices in Fairfield
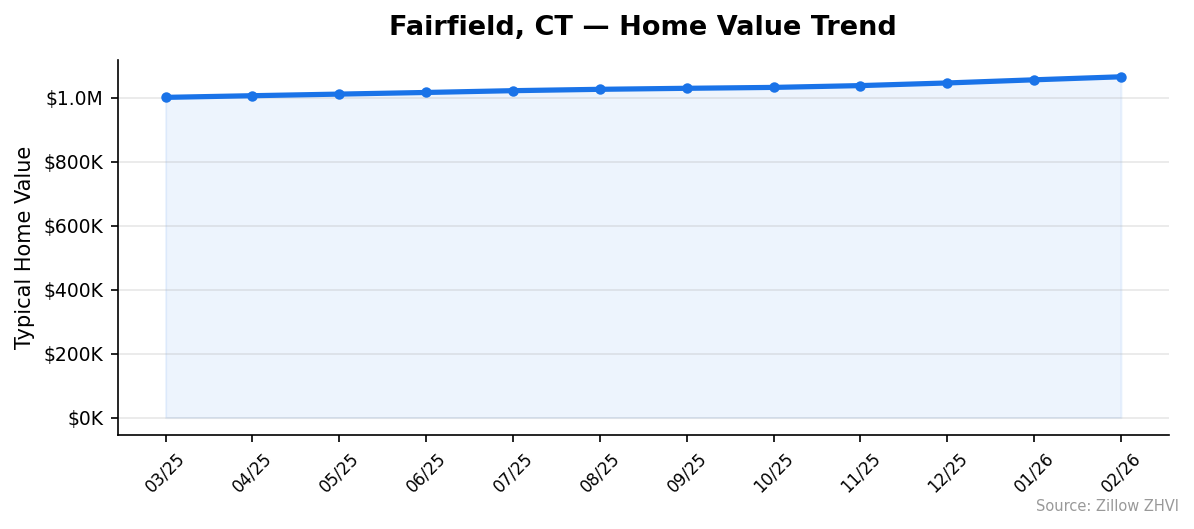
The data shows a market still in expansion mode. Twelve months ago the typical Fairfield home was worth $1,001,047. Today it’s $1,065,388 — a gain of $64,341 in a single year. That works out to about $5,360 of equity built per month, before you make a single mortgage payment.
| Metric | Value |
|---|---|
| Median home value | $1,065,388 |
| Year-over-year change | +6.4% |
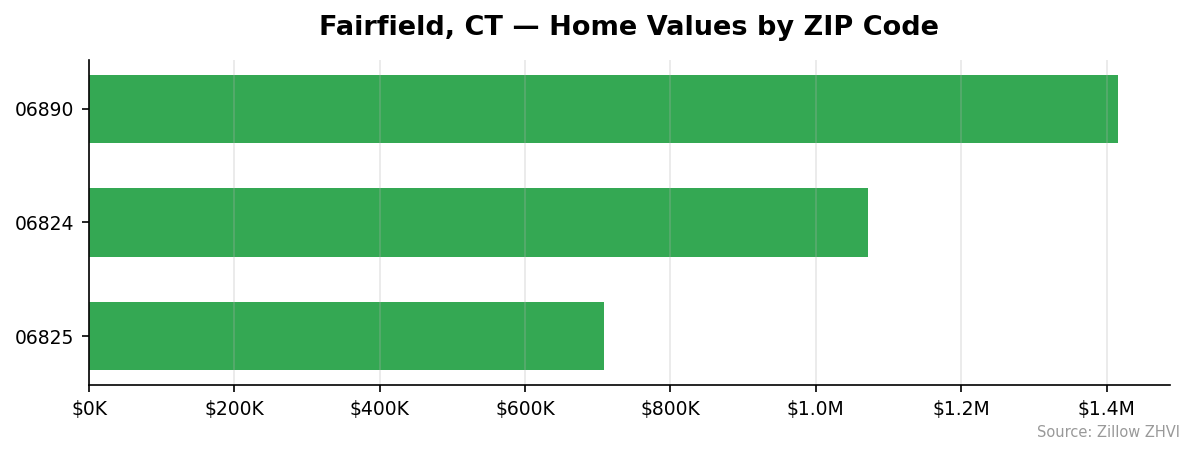
| Cheapest ZIP | $708,726 (06825) |
| Priciest ZIP | $1,416,342 (06890) |
| Spread (max ÷ min) | 2.0x |
| ZIP codes covered | 3 |
| Metro area | Bridgeport-Stamford-Norwalk |
The spread between Fairfield’s cheapest and most expensive ZIP is significant. A buyer with $710K can find an entry point. A buyer with $1.4M is shopping in a different market entirely, even though both addresses share the same town hall.
You won’t find a Fairfield home below $700K in any of the tracked ZIPs. The lowest typical value sits at $708,726 — already higher than the median home in most U.S. metros. For context, the national typical home value is closer to $360K, putting Fairfield’s median nearly 3x above the U.S. average.
Fairfield Home Prices by Neighborhood
Three ZIP codes carry the entire town. Each one tells a different story.
| ZIP | Typical Home Value | Typical Monthly Rent | Vs Town Median |
|---|---|---|---|
| 06890 | $1,416,342 | Not available | +33% |
| 06824 | $1,071,096 | $3,895 | +1% |
| 06825 | $708,726 | $2,832 | -33% |
Most Expensive
- 06890 at $1,416,342 — the priciest ZIP by a wide margin, sitting roughly $345K above the town median. This is Southport territory, and rent data isn’t tracked here, suggesting most homes are owner-occupied rather than leased.
- 06824 at $1,071,096 — almost exactly the town median, and the only Fairfield ZIP with both healthy sales values and active rental data ($3,895/month typical rent).
- 06825 at $708,726 — even the cheapest ZIP in Fairfield ranks as expensive by national standards.
Most Affordable
- 06825 at $708,726 — the entry point, 33% below the town median. Rent here runs $2,832, the lowest in town.
- 06824 at $1,071,096 — the middle option, where buyers get the closest thing to a “typical” Fairfield home.
- 06890 at $1,416,342 — the only other ZIP in town, but firmly in luxury territory.
Rent vs Buy in Fairfield
Renting wins on monthly cash flow. Buying wins on long-term equity. Here’s the math.
| Path | Monthly Cost (estimate) |
|---|---|
| Rent in 06825 | $2,832 |
| Rent in 06824 | $3,895 |
| Buy at $1,065,388 median (P&I, 20% down, 7% rate) | ~$5,670 |
| Buy + property tax + insurance (estimate) | ~$7,500 |
A renter in 06825 pays $2,832 a month. A buyer with 20% down on a median-priced Fairfield home faces a monthly nut roughly 2.6x higher once you fold in Connecticut’s property taxes, which run high in this part of the state. Even the most expensive Fairfield rental ($3,895) is roughly half the all-in cost of owning the median home.
The break-even tilts toward buying only if prices keep rising at the current 6.4% annual pace. At that rate, a $1.07M home gains about $68K in value per year — which more than offsets the cost gap between rent and ownership for someone planning to stay 5+ years.
If you’re shorter-term, rent. If you’re long-term and have the down payment, the math gets more interesting.
Fairfield Housing Market Trends
Twelve straight months of gains. Not a single dip.
| Month | Typical Value | Monthly Change |
|---|---|---|
| Feb 2026 | $1,065,388 | +0.9% |
| Jan 2026 | $1,055,936 | +0.9% |
| Dec 2025 | $1,046,095 | +0.8% |
| Nov 2025 | $1,037,821 | +0.5% |
| Oct 2025 | $1,032,199 | +0.3% |
| Sep 2025 | $1,029,400 | +0.3% |
| Aug 2025 | $1,026,231 | +0.4% |
| Jul 2025 | $1,021,992 | +0.6% |
| Jun 2025 | $1,016,372 | +0.5% |
| May 2025 | $1,011,259 | +0.5% |
| Apr 2025 | $1,006,256 | +0.5% |
| Mar 2025 | $1,001,047 | — |
The pattern shows acceleration, not cooling. Monthly gains in the back half of 2025 were modest — under 0.5% — but starting in November the tape picks up speed. The last three months have averaged 0.87% gains. Annualize that and you get a 10.4% pace, well above the trailing 12-month figure of 6.4%.
In other words: prices aren’t just rising in Fairfield, they’re rising faster.
Is Fairfield a Good Place to Buy in 2026?
For sellers, this is a strong market. Twelve months of gains and accelerating momentum mean homes priced fairly should move.
For buyers, the picture is harder. You’re paying near 12-month highs in every ZIP. There’s no “deal” forming on the chart — just a steady upward grind. The cheapest entry remains 06825 at $708,726, where rents are also lowest at $2,832. That ZIP is where first-time Fairfield buyers will find the path of least resistance.
If you’re stretching to buy at $1M+, the question isn’t whether Fairfield is overpriced. The question is whether a 6.4% annual gain continues. If it does, today’s price looks reasonable in five years. If it stalls, you’re sitting on heavy carrying costs without the appreciation to offset them.
Fairfield Housing Market Outlook for 2026-2027
The 3-month trend suggests continued gains. November-to-February averaged 0.87% per month. If the current pace continues through summer 2026, the typical Fairfield home would cross $1.10M by August.
That’s a big “if.” Spring is historically the strongest selling season in Connecticut, so the recent acceleration may partly reflect seasonal demand rather than a structural shift. The deceleration through the second half of 2025 is a counter-signal — it shows the market can cool when conditions change.
What the data does support: no sign of imminent decline. Twelve consecutive months of gains, with the trend strengthening into 2026, points to short-term momentum staying positive. The 3-6 month direction looks higher, with the rate of gain depending heavily on mortgage rates and broader Fairfield County demand.
Similar Markets in CT
If Fairfield’s prices are out of reach, the rest of Connecticut offers options across nearly every price band:
- Greenwich — the only nearby market that consistently outprices Fairfield, for buyers shopping above $1.5M.
- Stamford — same metro area, generally lower prices, more rental inventory and condo stock.
- Norwalk — coastal alternative in the same Bridgeport-Stamford-Norwalk metro, typically more affordable.
- Bridgeport — the metro’s largest city and lowest entry point for first-time buyers.
- New Haven — different metro, university-driven economy, very different price profile.
Frequently Asked Questions
What is the average home price in Fairfield?
The average home price in Fairfield, CT is $1,065,388 as of February 2026. That figure represents the typical home across the town’s three ZIP codes, weighted from Zillow’s smoothed home value index.
Are home prices going up or down in Fairfield?
Up. Prices have risen 6.4% year over year, and have gained ground every single month for the past 12 months. Recent momentum is even stronger — the last three months alone have averaged 0.87% monthly gains.
Is it cheaper to rent or buy in Fairfield?
Renting. Typical Fairfield rents run from $2,832 to $3,895 per month depending on ZIP, while a buyer of a median-priced home faces roughly $7,500 a month once you include mortgage, Connecticut property taxes, and insurance. Buying makes more sense for long-term owners betting on continued price appreciation.
What is the most affordable neighborhood in Fairfield?
ZIP 06825 is the cheapest, with a typical home value of $708,726 — roughly $356K below the town median. It’s also where rents are lowest at $2,832, making it the natural entry point for first-time buyers and renters in Fairfield.
Methodology
Home values are based on the Zillow Home Value Index (ZHVI), a smoothed measure of typical home values in the 35th to 65th percentile range. Rent estimates use the Zillow Observed Rent Index (ZORI). Population figures come from the U.S. Census Bureau Population Estimates Program (2020-2024 vintage). All datasets are publicly available. Housing data updated 2026-02-28.