Hartford Home Prices: $201K, Up 6.4% — 5 ZIPs Analyzed (2026)
$201,000. That’s what a typical Hartford home is worth as of February 2026. Prices climbed 6.4% over the past year, one of the steeper gains among Connecticut’s larger cities.
Quick answer: The average home price in Hartford, CT is $200,823 as of February 2026, up 6.4% year over year.
Current Home Prices in Hartford
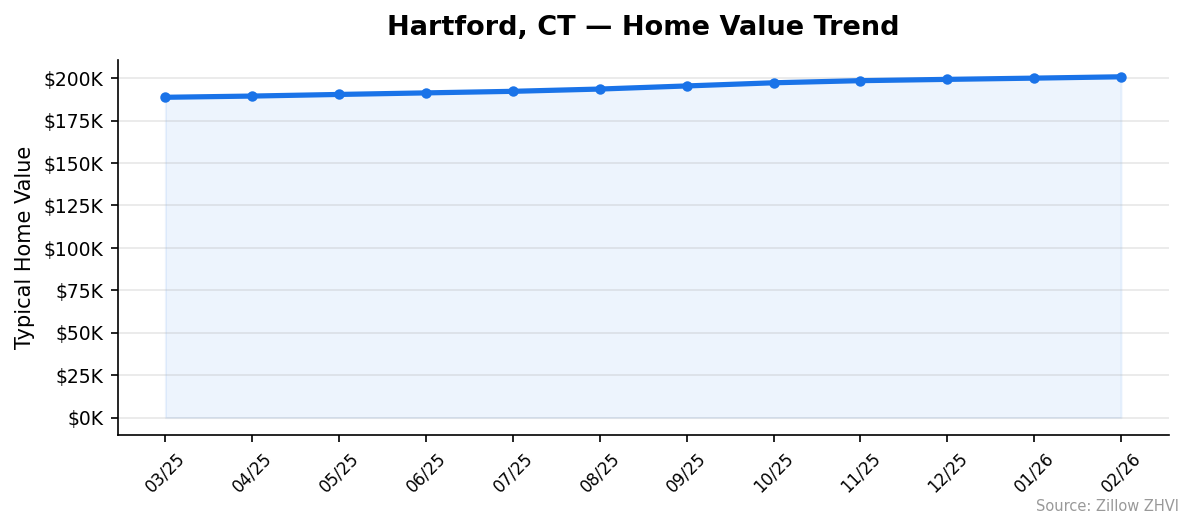
Hartford’s median home value sits at $200,823. That’s a $12,079 jump from the same month last year, when the typical home traded around $188,744.
| Metric | Value |
|---|---|
| Median home price | $200,823 |
| Year-over-year change | +6.4% |
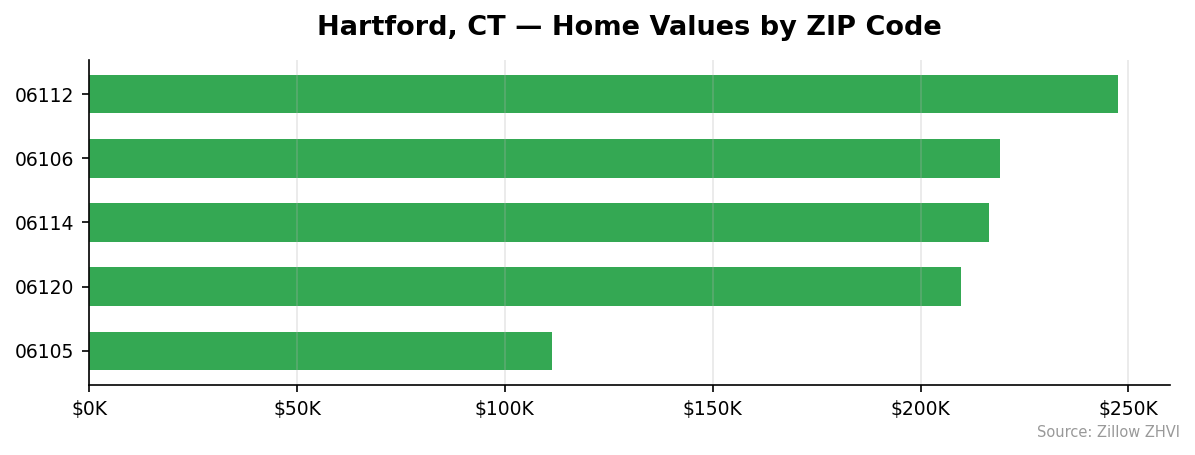
| Cheapest ZIP median | $111,323 |
| Most expensive ZIP median | $247,582 |
| ZIP codes analyzed | 5 |
| Data through | February 2026 |
The gap between Hartford’s cheapest and most expensive ZIPs is $136,259. A buyer in 06105 pays less than half what a buyer in 06112 pays for a typical home. That kind of spread inside one mid-sized city is unusual.
Hartford remains one of the cheaper mid-sized cities in the Northeast. The median in nearby Stamford runs several times higher. For Connecticut buyers priced out of Fairfield County, Hartford has quietly become the alternative.
The 6.4% annual gain outpaces wage growth in most U.S. metros. If that pace holds, the typical home would cross $213,000 by this time next year. The 12-month trend has been steady — no single month has dropped, and the monthly rate of increase picked up speed last summer.
Hartford Home Prices by Neighborhood
Five ZIP codes carry the bulk of Hartford’s housing stock. Prices range from the low $110Ks to nearly $250K.
| ZIP | Median Home Price | Median Rent |
|---|---|---|
| 06112 | $247,582 | Data not available |
| 06106 | $219,216 | $1,536 |
| 06114 | $216,390 | $1,553 |
| 06120 | $209,606 | $1,776 |
| 06105 | $111,323 | $1,255 |
Most Expensive
06112 tops the list at $247,582, roughly 23% above the city median. No rent data is available for this ZIP.
06106 ranks second at $219,216. Median rent runs $1,536, putting the price-to-rent ratio at about 142 — leaning toward renting on a pure cost basis.
06114 comes in just behind at $216,390 with rents at $1,553. The two ZIPs price almost identically per home and per rental.
Most Affordable
06105 is the outlier. At $111,323, it costs less than half the city median. Median rent of $1,255 makes the price-to-rent ratio about 89 — strongly favoring buying over renting.
06120 sits at $209,606 with the highest rent in the city at $1,776. That’s an unusually large rent figure for the price, hinting at tight rental supply in the area.
06114 rounds out the lower tier of pricier ZIPs. At $216,390, it’s still well below the city max.
Rent vs Buy in Hartford
Median rents in Hartford ZIPs run from $1,255 in 06105 to $1,776 in 06120. The blended average across the four ZIPs with rent data is roughly $1,530 a month.
A $200,823 home with 20% down ($40,165) and a 30-year mortgage at 7% carries a principal-and-interest payment near $1,069. Add Connecticut property taxes (among the highest in the country), insurance, and maintenance, and the all-in monthly cost climbs past $1,800.
That math flips by neighborhood. In 06105, a $111,323 home with 20% down means a P&I payment near $593. Even with taxes and insurance, total monthly costs land below $1,000 — well under the $1,255 median rent. Buying clearly wins in 06105 for anyone who can manage the down payment.
In 06120, the calculation is closer. The $1,776 rent runs near the all-in ownership cost on a $209,606 home, but ownership builds equity while renting does not.
The picture changes if you can’t put 20% down or plan to leave within five years. Closing costs and Connecticut taxes eat into shorter holding periods. Run your own numbers before deciding.
Population Growth and Migration
Hartford added 1,660 residents between 2020 and 2024, growing 1.4% over four years. Slow, but positive — and that matters for housing demand.
| Year | Population |
|---|---|
| 2020 | 120,469 |
| 2021 | 120,788 |
| 2022 | 120,888 |
| 2023 | 121,332 |
| 2024 | 122,129 |
The growth accelerated in the most recent year. Hartford gained 797 residents from 2023 to 2024, nearly half the four-year total in a single year.
Compared to other Connecticut cities, Hartford’s growth runs near the bottom of the pack:
| City | 2024 Population | 4-Year Growth |
|---|---|---|
| New Haven | 137,562 | +6.4% |
| New Britain | 75,871 | +4.0% |
| Norwalk | 93,661 | +3.0% |
| Danbury | 88,692 | +3.0% |
| Stamford | 139,134 | +2.7% |
| Hartford | 122,129 | +1.4% |
New Haven’s 6.4% gain dwarfs Hartford’s pace. But Hartford is still adding people, which keeps a floor under demand. Cities that lose residents see prices stagnate or fall. Cities that grow — even slowly — see prices rise. That’s part of why Hartford’s 6.4% home-price gain is happening despite modest population growth.
Hartford Housing Market Trends
The 12-month path shows uninterrupted growth. Every month posted a higher median than the one before.
| Month | Median Price |
|---|---|
| March 2025 | $188,744 |
| April 2025 | $189,464 |
| May 2025 | $190,423 |
| June 2025 | $191,339 |
| July 2025 | $192,259 |
| August 2025 | $193,595 |
| September 2025 | $195,428 |
| October 2025 | $197,287 |
| November 2025 | $198,537 |
| December 2025 | $199,301 |
| January 2026 | $200,028 |
| February 2026 | $200,823 |
Total gain over 12 months: $12,079, or 6.4%. The pace was steady — roughly $1,000 per month — but it picked up speed mid-summer. From August to October, prices added $3,692, the fastest three-month stretch in the data window.
The most recent months have cooled slightly. From January to February 2026, the median rose $795 — under the 12-month average pace. Whether that’s the start of a slowdown or seasonal noise remains to be seen.
Is Hartford a Good Place to Buy in 2026?
The data points to a seller-friendly market. Prices rose every single month for the past year. There’s no sign of distress in the numbers.
But “seller’s market” doesn’t mean “bad for buyers.” Hartford’s $200,823 median sits well below the U.S. median of around $360K. You’re paying a premium relative to last year, but you’re starting from a low base.
Affordability is Hartford’s main draw. A buyer with $50,000 saved can put 20% down on the median home and still have cash left over. That’s not true in most Northeastern cities.
The cheapest ZIP, 06105, looks underpriced relative to its rent. If you’re buying for cash flow, that’s the place to look.
If you’re a seller, the data favors patience for a few more months — momentum is still positive, though decelerating.
Hartford Housing Market Outlook for 2026-2027
Twelve straight months of gains is a strong signal. If the current pace continues, the median should test $210K by mid-2026 and approach $215K by year-end.
The 3-month trend shows slight cooling. February’s $795 monthly gain was the smallest in the data window. That could mean the market is approaching a near-term peak, or it could be winter seasonality.
Watch the spring numbers. If March and April post gains above $1,500, the rally has more room. If they come in under $800, the year-over-year rate will start compressing toward 4-5%. Either way, prices look unlikely to drop meaningfully in the next 6 months given the consistency of the trend.
Population growth — modest but positive — supports continued demand.
Similar Markets in CT
If Hartford’s median feels too high or too low for your search, these Connecticut cities have their own price profiles:
- Stamford — Connecticut’s most expensive market, where Hartford prices look like a bargain.
- New Haven — Faster population growth than Hartford with similar mid-tier pricing.
- Bridgeport — Another mid-priced Connecticut city often compared to Hartford by buyers.
- New Britain — A nearby Hartford-area city with similar affordability.
- Waterbury — Another option for budget-focused Connecticut buyers.
Frequently Asked Questions
What is the average home price in Hartford?
The average home price in Hartford, CT is $200,823 as of February 2026. That figure reflects the typical home in the 35th to 65th percentile of Hartford’s housing stock.
Are home prices going up or down in Hartford?
Hartford home prices are up 6.4% year over year. Prices have risen every single month for the past 12 months, with no monthly declines in the data.
Is it cheaper to rent or buy in Hartford?
It depends on the ZIP. In 06105, where homes run $111,323 and rents average $1,255, buying wins easily. In pricier ZIPs the math is closer, with all-in ownership costs running near or above median rent once Connecticut property taxes are factored in.
What is the most affordable neighborhood in Hartford?
The 06105 ZIP code is the cheapest, with a median home value of $111,323. That’s less than half the citywide median of $200,823 and the only Hartford ZIP under $200K.
Methodology
Home values are based on the Zillow Home Value Index (ZHVI), a smoothed measure of typical home values in the 35th to 65th percentile range. Rent estimates use the Zillow Observed Rent Index (ZORI). Population figures come from the U.S. Census Bureau Population Estimates Program (2020-2024 vintage). All datasets are publicly available. Housing data updated 2026-02-28.