Fremont Home Prices: $1.62M, Down 2.8% — 4 ZIPs Analyzed (2026)
$1,618,966. That’s what a typical home costs in Fremont right now — and it’s actually less than it was a year ago.
The average home price in Fremont, CA dropped 2.8% over the past twelve months. In a Bay Area city where seven-figure price tags are the baseline, that dip translates to roughly $46,000 off the top. Whether that counts as relief depends on your budget.
Quick answer: The average home price in Fremont, CA is $1,618,966 as of February 2026, down 2.8% year over year according to Zillow.
Current Home Prices in Fremont
Here’s a snapshot of where the Fremont housing market stands right now.
| Metric | Value |
|---|---|
| Median Home Value | $1,618,966 |
| Year-over-Year Change | -2.8% |
| Lowest ZIP Median | $1,327,420 |
| Highest ZIP Median | $2,209,574 |
| Number of ZIP Codes | 4 |
| Metro Area | San Francisco-Oakland-Berkeley, CA |
Fremont sits in the San Francisco-Oakland-Berkeley metro, one of the most expensive housing markets in the country. Even with a 2.8% decline, the median home here costs well over $1.6 million.
The price range tells a story of its own. The gap between the cheapest and most expensive ZIP code is $882,154. That’s nearly the price of an entire home in many U.S. cities.
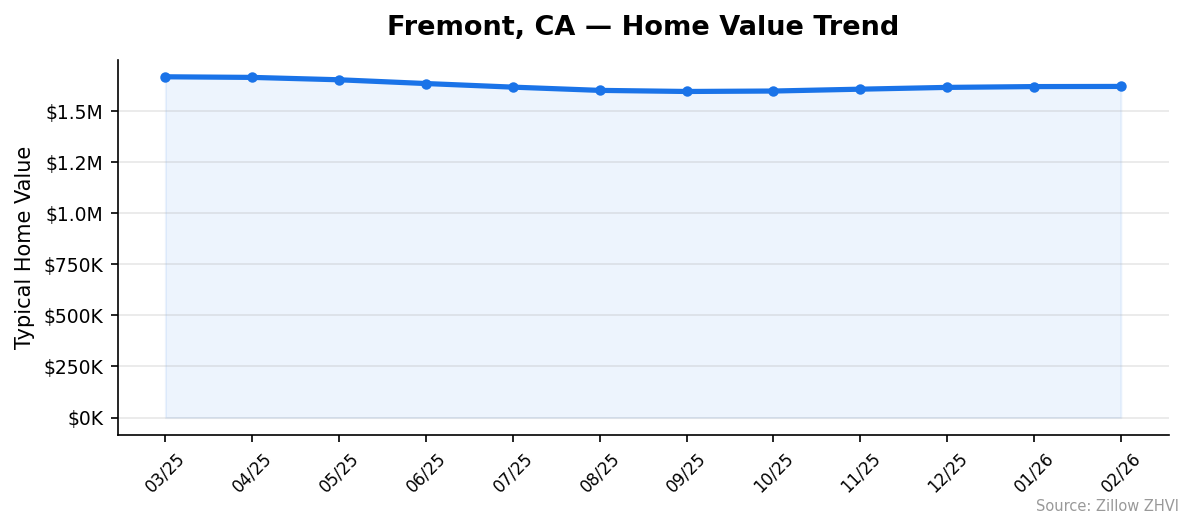
This year-over-year decline follows a pattern visible across parts of the Bay Area. Prices peaked around March 2025 at $1,666,088, slid through the summer and early fall, then began a slow recovery starting in October. The current median is still about $47,000 below last year’s high.
Fremont Home Prices by Neighborhood
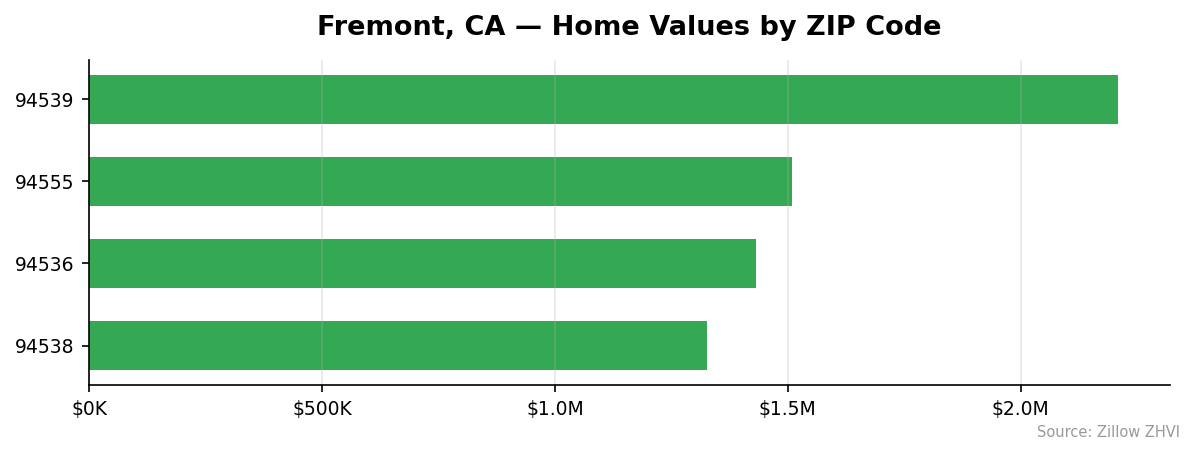
Fremont has four ZIP codes, and the spread between them is enormous.
| ZIP Code | Median Home Value | Avg. Monthly Rent |
|---|---|---|
| 94536 | $1,430,935 | $3,026 |
| 94538 | $1,327,420 | $2,916 |
| 94539 | $2,209,574 | $3,965 |
| 94555 | $1,507,934 | $3,180 |
Most Expensive
94539 dominates the top of the market at $2,209,574 — that’s 36% above the city-wide median. Rents here also run the highest at $3,965 per month, reflecting the premium buyers and renters pay for this area, which includes the Mission San Jose neighborhood and Fremont’s eastern hills.
Most Affordable
94538 is the entry point into Fremont homeownership at $1,327,420. That’s 18% below the city average. Rent follows suit — $2,916 per month is the lowest in the city. 94536 comes in second at $1,430,935, offering a middle ground between the city’s extremes with rents around $3,026.
Even the “affordable” end of Fremont runs well into seven figures. The cheapest ZIP still costs more than the median home in the vast majority of American cities.
Rent vs Buy in Fremont
Renting is dramatically cheaper than buying in Fremont right now.
| ZIP Code | Monthly Rent | Est. Monthly Mortgage* |
|---|---|---|
| 94536 | $3,026 | ~$8,700 |
| 94538 | $2,916 | ~$8,100 |
| 94539 | $3,965 | ~$13,400 |
| 94555 | $3,180 | ~$9,200 |
Estimated mortgage based on 20% down, 6.5% rate, 30-year fixed. Does not include taxes, insurance, or HOA.
The city-wide average rent runs about $3,272 per month. A mortgage payment on the median home — even with 20% down — lands somewhere around $8,700. That’s a gap of over $5,400 every month.
From a pure monthly cost standpoint, renting wins by a wide margin. You’d need to put down roughly 50-60% to bring mortgage payments in line with current rents.
That math doesn’t account for equity building, tax deductions, or appreciation. But with prices declining 2.8% over the past year, the appreciation argument has weakened. Buyers need to be confident in a long holding period to justify the premium over renting.
Population Growth and Migration
Fremont is slowly losing residents.
| Year | Population |
|---|---|
| 2020 | 230,445 |
| 2021 | 227,910 |
| 2022 | 227,359 |
| 2023 | 227,587 |
| 2024 | 228,192 |
The city dropped from 230,445 residents in 2020 to 228,192 by 2024 — a 1.0% decline over four years. The biggest loss came between 2020 and 2022, when the city shed about 3,000 people. Since then, population has stabilized and even ticked up slightly.
Here’s how Fremont compares to other California cities:
| City | 2024 Population | 4-Year Growth |
|---|---|---|
| San Diego | 1,404,452 | +1.4% |
| Fresno | 550,105 | +1.4% |
| Sacramento | 535,798 | +1.9% |
| Oakland | 443,554 | +0.6% |
| Bakersfield | 417,468 | +3.0% |
| Fremont | 228,192 | -1.0% |
Every comparison city grew while Fremont shrank. Bakersfield added residents at 3.0%, Sacramento at 1.9%. The pattern suggests some migration from expensive Bay Area cities toward more affordable inland areas.
For housing, a shrinking population means less demand pressure — one factor behind the year-over-year price decline.
Fremont Housing Market Trends
The 12-month price trajectory reveals a clear arc: decline, bottom, and slow recovery.
| Month | Avg. Home Value | Min (by ZIP) | Max (by ZIP) |
|---|---|---|---|
| Mar 2025 | $1,666,088 | $1,384,720 | $2,235,267 |
| Apr 2025 | $1,663,098 | $1,379,588 | $2,235,766 |
| May 2025 | $1,651,448 | $1,366,321 | $2,225,299 |
| Jun 2025 | $1,633,062 | $1,348,766 | $2,204,605 |
| Jul 2025 | $1,615,522 | $1,331,400 | $2,184,453 |
| Aug 2025 | $1,599,646 | $1,317,164 | $2,165,035 |
| Sep 2025 | $1,594,285 | $1,311,172 | $2,159,731 |
| Oct 2025 | $1,596,461 | $1,311,050 | $2,165,085 |
| Nov 2025 | $1,605,499 | $1,316,228 | $2,182,522 |
| Dec 2025 | $1,614,227 | $1,322,500 | $2,198,544 |
| Jan 2026 | $1,618,202 | $1,326,015 | $2,207,638 |
| Feb 2026 | $1,618,966 | $1,327,420 | $2,209,574 |
Prices peaked in March 2025 at $1,666,088 and fell for six straight months, bottoming out at $1,594,285 in September. That’s a $71,803 drop — about 4.3% peak-to-trough.
Since October, the market has recovered $24,681. The rebound is real but modest. Prices in February were essentially flat compared to January, gaining just $764. The recovery is losing steam.
Is Fremont a Good Place to Buy in 2026?
The numbers paint a mixed picture.
On the buyer’s side: prices are down 2.8% year over year, and the market has cooled significantly from its March 2025 peak. If you’ve been priced out before, you have slightly more room now. The population is flat to declining, which means less competition from new residents.
On the seller’s side: Fremont remains a $1.6 million market in a major tech employment corridor. The five-month recovery from September’s bottom shows the floor is holding. Homes here are still within commuting distance of major employers in Silicon Valley and the broader Bay Area.
The rent-versus-buy math heavily favors renting for now. Unless you plan to hold a property for at least 7-10 years, the premium over renting is hard to justify at current prices and rates.
Buyers with large down payments and long time horizons are best positioned. First-time buyers face steep barriers even with the recent dip.
Fremont Housing Market Outlook for 2026-2027
The monthly data suggests Fremont prices are approaching a plateau.
From October through February, the city gained about $24,700 in median value — but the month-over-month gains are shrinking. February added just $764 over January. If the current pace continues, prices may hover near the $1.62M mark through spring 2026.
The seasonal pattern in the data shows prices tend to peak in spring and soften through summer and fall. The March-to-September 2025 decline of 4.3% could repeat to some degree in 2026 if the same seasonal forces apply.
The 3-month trend from December through February shows slow but positive movement — about $1,600 per month in gains. That’s nearly flat in a market at this price level. Barring a shift in mortgage rates or employment conditions in the Bay Area tech sector, expect a sideways market through the rest of 2026.
Similar Markets in CA
If you’re researching Fremont, these California cities offer useful comparisons.
- Los Angeles — California’s largest market, with a very different price profile from the Bay Area.
- San Diego — Another high-cost coastal city, growing at 1.4% compared to Fremont’s decline.
- Bakersfield — The fastest-growing California city on our list at 3.0%, with far lower prices than Fremont.
- Fresno — An inland alternative with strong population growth and significantly more affordable housing.
- Long Beach — A Southern California coastal option worth comparing for buyers considering a different metro entirely.
Frequently Asked Questions
What is the average home price in Fremont?
The average home price in Fremont is $1,618,966 as of February 2026. Prices across the city’s four ZIP codes range from $1,327,420 in the 94538 area to $2,209,574 in 94539. That’s a spread of nearly $900,000 within a single city.
Are home prices going up or down in Fremont?
Home prices in Fremont are down 2.8% compared to a year ago. Prices peaked at $1,666,088 in March 2025 and dropped to $1,594,285 by September before partially recovering. The current trend shows very slow upward movement — just $764 gained between January and February 2026.
Is it cheaper to rent or buy in Fremont?
Renting is much cheaper. The average monthly rent across Fremont is about $3,272, while a mortgage on the median home would cost roughly $8,700 per month with 20% down at 6.5% interest. That’s a difference of over $5,400 per month, making the buy-versus-rent calculation heavily one-sided at current price and rate levels.
What is the most affordable neighborhood in Fremont?
ZIP code 94538 has the lowest median home value at $1,327,420 and the lowest average rent at $2,916 per month. It’s 18% below the city-wide median. The next most affordable is 94536 at $1,430,935, which still sits well below the Fremont average.
Methodology
Home values are based on the Zillow Home Value Index (ZHVI), a smoothed measure of typical home values in the 35th to 65th percentile range. Rent estimates use the Zillow Observed Rent Index (ZORI). Population figures come from the U.S. Census Bureau Population Estimates Program (2020-2024 vintage). All datasets are publicly available. Housing data updated 2026-02-28.