San Diego Home Prices: $1.14M, Down 2.1% — 33 ZIPs Analyzed (2026)
$1,139,903. That’s what a typical home in San Diego costs right now. Prices have slipped 2.1% over the past year, marking a mild correction after years of steep gains. For buyers watching from the sidelines, the question is whether this dip has room to run.
Quick answer: The average home price in San Diego, CA is $1,139,903 as of February 2026, down 2.1% year over year according to Zillow.
Current Home Prices in San Diego
San Diego remains one of the most expensive housing markets in California. Here’s the snapshot:
| Metric | Value |
|---|---|
| Median Home Value | $1,139,903 |
| Year-Over-Year Change | -2.1% |
| Lowest ZIP Code Value | $599,198 |
| Highest ZIP Code Value | $2,784,556 |
| Number of ZIP Codes Tracked | 33 |
| Data as of | February 2026 |
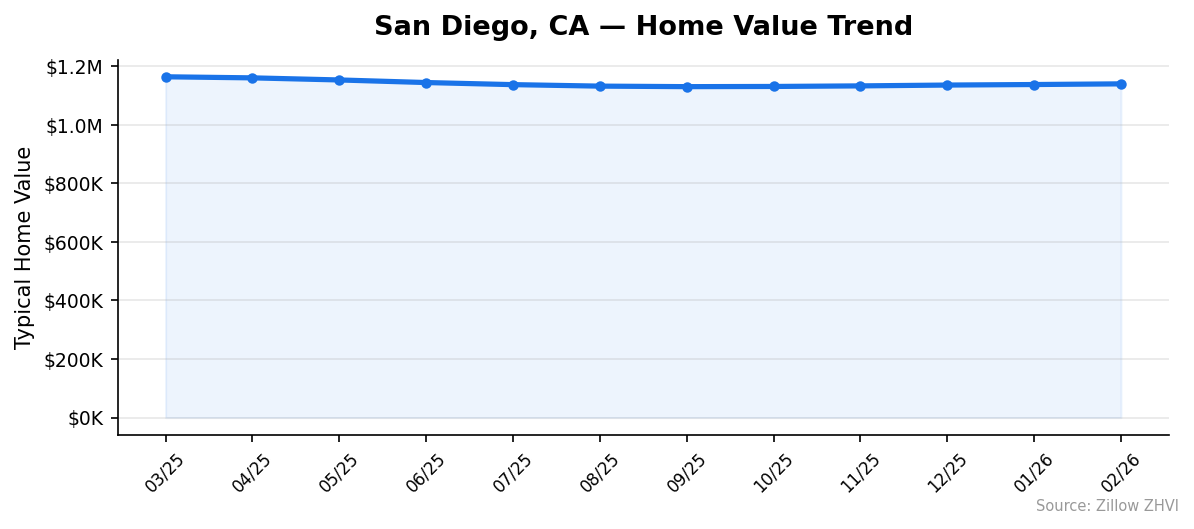
The 2.1% annual decline translates to roughly $24,000 off the typical home price compared to a year ago. That sounds meaningful, but context matters. San Diego prices peaked around $1,164,053 in March 2025 and bottomed at $1,130,379 in September before climbing back. The current price sits between those two marks.
The spread between the cheapest and most expensive ZIP codes is massive — $2.18 million separates a home in 92108 from one in 92014. That range tells you San Diego isn’t one market. It’s dozens, and your experience depends entirely on where you look.
San Diego Home Prices by Neighborhood
All 33 tracked ZIP codes, sorted from most to least expensive:
| ZIP Code | Median Home Value | Typical Rent |
|---|---|---|
| 92014 | $2,784,556 | $6,195 |
| 92037 | $2,301,245 | $3,981 |
| 92130 | $2,056,392 | $3,940 |
| 92106 | $1,749,839 | $2,841 |
| 92127 | $1,625,717 | $3,509 |
| 92109 | $1,487,916 | $3,023 |
| 92131 | $1,483,241 | $3,444 |
| 92107 | $1,451,191 | $2,749 |
| 92129 | $1,352,601 | $3,317 |
| 92121 | $1,091,001 | — |
| 92117 | $1,084,987 | $2,845 |
| 92122 | $1,083,125 | $3,119 |
| 92103 | $1,071,665 | $2,713 |
| 92124 | $1,056,895 | $3,049 |
| 92120 | $1,031,214 | $2,641 |
| 92110 | $1,003,686 | $2,890 |
| 92126 | $996,358 | $2,745 |
| 92128 | $995,642 | $2,877 |
| 92116 | $986,918 | $2,499 |
| 92119 | $973,107 | $2,548 |
| 92123 | $956,414 | $3,089 |
| 92111 | $950,406 | $2,816 |
| 92104 | $947,272 | $2,483 |
| 92154 | $732,393 | $2,867 |
| 92101 | $730,784 | $2,870 |
| 92114 | $730,110 | $2,678 |
| 92102 | $725,494 | $2,495 |
| 92139 | $724,588 | $3,424 |
| 92173 | $680,761 | $2,458 |
| 92105 | $675,847 | $2,048 |
| 92113 | $642,182 | $2,268 |
| 92108 | $599,198 | $3,067 |
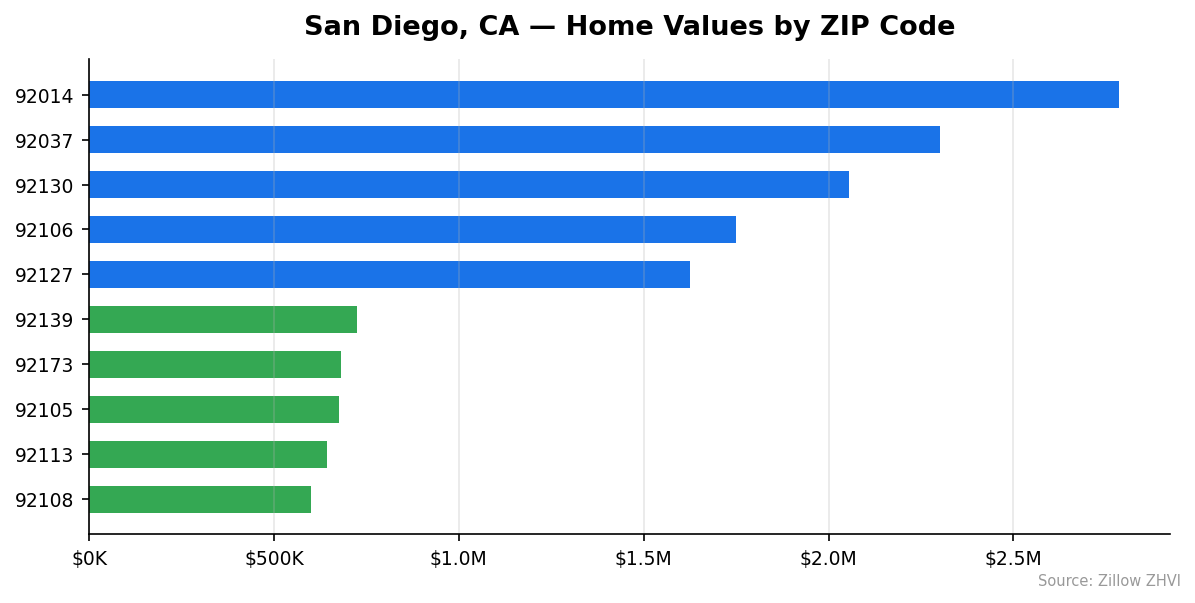
Most Expensive ZIP Codes
92014 — $2,784,556. This is the priciest ZIP in San Diego by a wide margin, more than double the city median, with rents at $6,195/month reflecting the premium.
92037 — $2,301,245. Home values here run about 2x the citywide average, and rents of $3,981/month rank second-highest in the city.
92130 — $2,056,392. Just over $2 million for the typical home, with rents near $3,940/month — close behind 92037.
Most Affordable ZIP Codes
92108 — $599,198. The only ZIP below $600,000, making it the clear entry point for buyers priced out of the rest of the city. Rents here are $3,067/month, surprisingly above the citywide middle.
92113 — $642,182. About 44% below the city median. Rents of $2,268/month are among the lowest tracked.
92105 — $675,847. Affordable by San Diego standards at 41% below median, with the lowest rents in the dataset at $2,048/month.
Rent vs Buy in San Diego
Renting is far cheaper than buying in San Diego right now. Here’s the math.
A median-priced home at $1,139,903 with 20% down means a $911,922 mortgage. At a 6.5% rate over 30 years, the monthly principal and interest payment comes to roughly $5,765. Add property taxes (about 1.1% annually, or $1,045/month) and homeowner’s insurance (around $200/month), and you’re looking at approximately $7,010 per month before HOA fees or maintenance.
Rents across the city’s ZIP codes range from $2,048 to $6,195 per month. Most neighborhoods fall between $2,500 and $3,500.
| Cost | Monthly |
|---|---|
| Mortgage (P&I at 6.5%) | ~$5,765 |
| Property Tax | ~$1,045 |
| Insurance | ~$200 |
| Total Ownership Cost | ~$7,010 |
| Typical Rent | $2,500–$3,500 |
Buying costs roughly 2x to 2.8x what renting costs, depending on the neighborhood. The gap is wide enough that renting and investing the difference could make financial sense — at least in the short term. Ownership still builds equity, but the monthly cash flow hit is steep at current prices and rates.
Only one ZIP code has rents approaching ownership costs: 92014, where rent runs $6,195/month. Everywhere else, the math favors renting by a large margin.
Population Growth and Migration
San Diego’s population reached 1,404,452 in 2024. The city has added about 19,600 residents since 2020, a 1.4% increase over four years.
| Year | Population |
|---|---|
| 2020 | 1,384,824 |
| 2021 | 1,374,972 |
| 2022 | 1,388,730 |
| 2023 | 1,394,555 |
| 2024 | 1,404,452 |
The trend dipped in 2021 — a pattern seen in many California cities during the pandemic — before recovering. Growth has been steady since 2022, adding roughly 5,000 to 10,000 people per year.
How does San Diego compare to other California cities?
| City | 2024 Population | 4-Year Growth |
|---|---|---|
| Bakersfield | 417,468 | 3.0% |
| Sacramento | 535,798 | 1.9% |
| Fresno | 550,105 | 1.4% |
| San Diego | 1,404,452 | 1.4% |
| Stockton | 324,975 | 1.2% |
| Oakland | 443,554 | 0.6% |
San Diego’s growth rate matches Fresno and trails Bakersfield and Sacramento. But in absolute terms, San Diego added more people than any city on this list. More residents means more housing demand, which puts a floor under prices even as the market cools.
San Diego Housing Market Trends
Here’s how prices have moved over the last 12 months:
| Month | Median Home Value | Low | High |
|---|---|---|---|
| Mar 2025 | $1,164,053 | $634,233 | $2,804,077 |
| Apr 2025 | $1,160,386 | $630,830 | $2,795,900 |
| May 2025 | $1,153,228 | $625,675 | $2,778,128 |
| Jun 2025 | $1,144,412 | $620,515 | $2,753,611 |
| Jul 2025 | $1,137,238 | $615,151 | $2,738,689 |
| Aug 2025 | $1,132,173 | $609,701 | $2,734,148 |
| Sep 2025 | $1,130,379 | $605,160 | $2,738,565 |
| Oct 2025 | $1,131,025 | $602,454 | $2,746,986 |
| Nov 2025 | $1,132,964 | $600,704 | $2,755,978 |
| Dec 2025 | $1,135,804 | $599,676 | $2,765,695 |
| Jan 2026 | $1,137,612 | $599,250 | $2,772,531 |
| Feb 2026 | $1,139,903 | $599,198 | $2,784,556 |
Prices fell for six straight months from March through September 2025, shedding about $33,700 from peak to trough. Since October, they’ve been inching back up — five consecutive months of gains totaling roughly $9,500.
The floor of the market (lowest ZIP) dropped from $634,233 to $599,198 over the year, a steeper decline than the median. The ceiling (highest ZIP) followed a similar pattern but has recovered more aggressively, reaching a new 12-month high of $2,784,556 in February.
The takeaway: the high end is bouncing back faster than entry-level homes.
Is San Diego a Good Place to Buy in 2026?
The data paints a mixed picture.
On the buyer’s side: prices are down 2.1% year over year, and the mid-2025 correction wiped about $34,000 off the typical home. If you were waiting for a pullback, this is one — modest as it is.
On the seller’s side: the five-month rebound since September suggests the floor has been found. Population growth continues. And with 1.4 million people in the city, demand isn’t going away.
The rent-vs-buy gap is the biggest concern. Paying $7,000/month to own a home that would rent for $3,000 means you’re betting on long-term appreciation to justify the premium. At current rates, that bet takes years to pay off.
If you’re buying to live in for 7+ years, the recent dip offers a slightly better entry point than a year ago. If you’re looking for a short-term investment, the numbers don’t support it at today’s mortgage rates.
San Diego Housing Market Outlook for 2026-2027
The five-month upward trend from October 2025 through February 2026 shows prices gaining about $1,900 per month on average. That’s slow but persistent.
If the current pace continues, median values could approach $1,150,000 by mid-2026 — still below the March 2025 peak of $1,164,053. A return to that peak would require roughly 13 more months at the current rate.
The 3-month trend suggests prices are stabilizing rather than accelerating. Monthly gains have been consistent but small: $2,291 (Feb), $1,808 (Jan), $2,840 (Dec). There’s no sign of a sharp reversal in either direction.
Watch mortgage rates. If rates drop below 6%, the buying math improves and demand could push prices up faster. If rates stay above 6.5%, expect this slow grind to continue.
Similar Markets in CA
If you’re shopping in California but finding San Diego’s $1.14M median steep, here are other markets worth comparing:
- Los Angeles — the state’s largest city with its own wide price range across neighborhoods.
- Long Beach — a Southern California coastal market that often undercuts LA and San Diego.
- Chula Vista — right next door in the San Diego metro, typically more affordable than the city proper.
- Bakersfield — California’s fastest-growing city on this list at 3.0%, with prices well below the coast.
- Fresno — Central Valley option with the same 1.4% population growth as San Diego at a fraction of the price.
Frequently Asked Questions
What is the average home price in San Diego?
The average home price in San Diego is $1,139,903 as of February 2026. Prices across the city’s 33 tracked ZIP codes range from $599,198 to $2,784,556, so your actual cost depends heavily on neighborhood.
Are home prices going up or down in San Diego?
Prices are down 2.1% compared to a year ago. They fell from a peak of $1,164,053 in March 2025 to a low of $1,130,379 in September, then started climbing again. The recent trend is slightly upward.
Is it cheaper to rent or buy in San Diego?
Renting is much cheaper. A mortgage on a median-priced home costs roughly $7,010/month with taxes and insurance, while typical rents across the city range from $2,048 to $3,500. You’d pay at least double to own versus rent in most neighborhoods.
What is the most affordable neighborhood in San Diego?
ZIP code 92108 has the lowest median home value at $599,198 — about 47% below the citywide median. ZIP codes 92113 ($642,182) and 92105 ($675,847) are the next most affordable options.
Methodology
Home values are based on the Zillow Home Value Index (ZHVI), a smoothed measure of typical home values in the 35th to 65th percentile range. Rent estimates use the Zillow Observed Rent Index (ZORI). Population figures come from the U.S. Census Bureau Population Estimates Program (2020-2024 vintage). All datasets are publicly available. Housing data updated 2026-02-28.