Grants Pass Home Prices: $412K, Down 0.1% — 4 ZIPs (2026)
$412,224. That’s what a typical home in Grants Pass costs as of February 2026. The price is down 0.1% from a year ago — essentially flat after two years of small monthly drift.
Quick answer: The average home price in Grants Pass, OR is $412,224 as of February 2026, down 0.1% year over year according to Zillow.
Current Home Prices in Grants Pass
The Grants Pass housing market is one of the quietest in Oregon right now. Prices haven’t moved meaningfully in either direction for 12 months.
| Metric | Value |
|---|---|
| Median home value | $412,224 |
| Year-over-year change | -0.1% |
| Lowest ZIP value | $378,281 |
| Highest ZIP value | $453,627 |
| ZIP code spread | $75,346 |
| ZIP codes tracked | 4 |
| Data through | February 2026 |
The gap between the cheapest and priciest ZIP is about $75,000. That’s a 20% spread within a small metro — meaningful if you’re choosing between neighborhoods, but narrow compared with bigger Oregon markets like Portland.
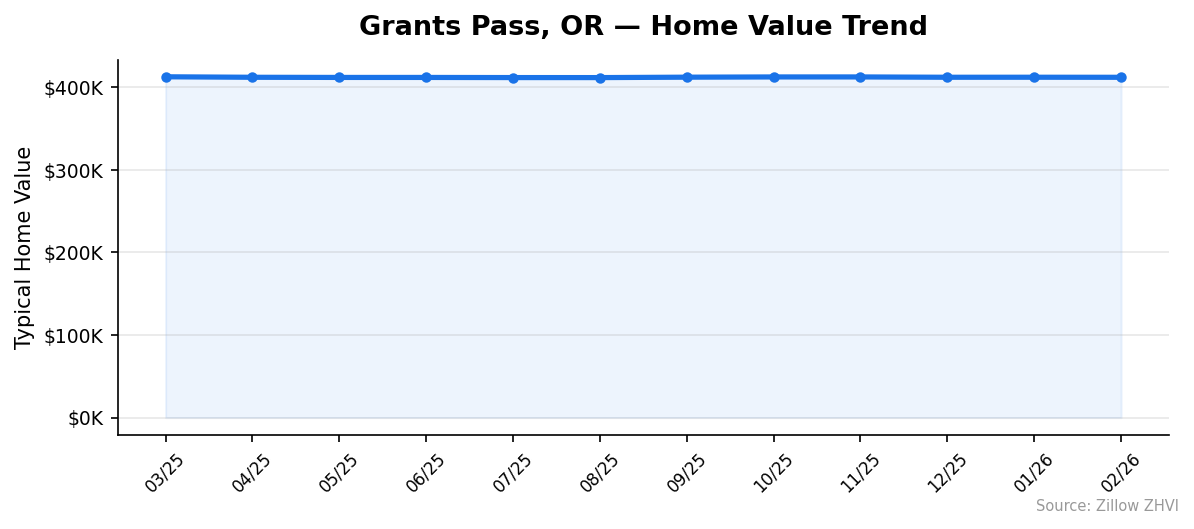
The overall picture: a market that peaked in spring 2025 around $412,836, drifted down through summer, and has held in the $411K-$412K band for nine straight months. No crash. No rebound. Just stasis.
For a buyer, this means you’re not chasing a moving target. For a seller, the price you list at today is probably close to what you would have gotten last spring — and last fall.
Grants Pass Home Prices by Neighborhood
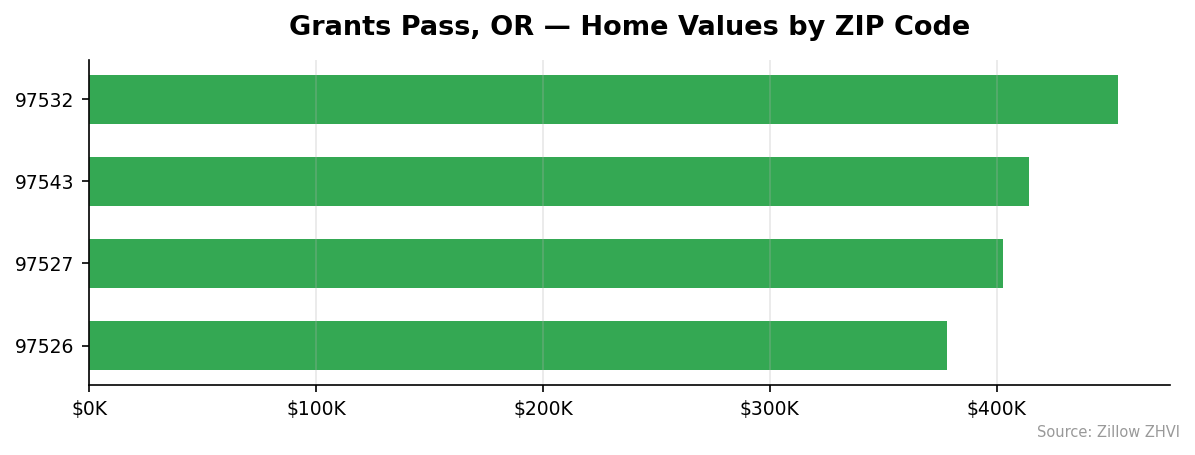
Four ZIPs cover the Grants Pass market. Here’s how they stack up.
| ZIP Code | Median Value | Avg. Rent (ZORI) |
|---|---|---|
| 97526 | $378,281 | $1,638 |
| 97527 | $402,967 | $1,521 |
| 97543 | $414,021 | Data not available |
| 97532 | $453,627 | Data not available |
Most Expensive
97532 — $453,627. The priciest ZIP in town, sitting about 10% above the city median. No tracked rent data here.
97543 — $414,021. Just above the city average. Mid-tier pricing.
97527 — $402,967. Slightly below median, with the lower of the two tracked rents at $1,521/month.
Most Affordable
97526 — $378,281. The cheapest ZIP, about 8% under the city average. Notably, it has the highest tracked rent — $1,638/month — which suggests rental demand is stronger here than ownership prices imply.
97527 — $402,967. Second cheapest. Rent runs $1,521/month.
97543 — $414,021. Third in the affordability stack, but priced almost identically to the city median.
If your budget tops out under $400K, ZIP 97526 is the only option in Grants Pass tracked by Zillow.
Rent vs Buy in Grants Pass
Rent data is available for two of the four ZIPs.
| ZIP | Avg. Rent | Annual Rent |
|---|---|---|
| 97526 | $1,638 | $19,656 |
| 97527 | $1,521 | $18,252 |
| Average | $1,580 | $18,960 |
Now compare to buying. On the city median of $412,224 with 20% down ($82,445), you’re financing $329,779. At a 7% mortgage rate, principal and interest alone runs about $2,194/month. Add property tax (Oregon averages ~0.9% of value, or $309/month here) and insurance ($120/month), and the total comes to roughly $2,623/month — before maintenance.
That’s about $1,000 more per month than the average rent. Over a year, you’d pay $12,500 more to own than to rent.
The case for buying still exists — equity, fixed payments, tax deductions — but renting is the cheaper monthly cost in Grants Pass right now. Worth running the numbers if you’re not staying long-term.
Population Growth and Migration
Grants Pass is growing, but slowly.
| Year | Population |
|---|---|
| 2020 | 39,244 |
| 2021 | 39,432 |
| 2022 | 39,121 |
| 2023 | 39,325 |
| 2024 | 39,468 |
Total gain over four years: 224 people, or 0.6%. The city dipped in 2022 before recovering. It has not yet exceeded its 2021 peak by much.
Compare that to other Oregon cities:
| City | 2024 Population | 4-Year Growth |
|---|---|---|
| Bend | 106,926 | +7.3% |
| Corvallis | 61,993 | +6.3% |
| Hillsboro | 110,337 | +3.0% |
| Salem | 180,406 | +2.5% |
| Beaverton | 98,302 | +0.8% |
| Grants Pass | 39,468 | +0.6% |
Grants Pass trails most of the state. Bend is growing more than 12 times faster. That tells you something about the housing demand picture: there’s no flood of new residents pushing prices up. The flat price trend over the past year tracks with the flat population.
For buyers, slow growth typically means less competition and more negotiating room. For sellers, it means patience.
Grants Pass Housing Market Trends
Here’s the 12-month picture, month by month.
| Month | Median Value |
|---|---|
| March 2025 | $412,836 |
| April 2025 | $412,240 |
| May 2025 | $412,054 |
| June 2025 | $412,047 |
| July 2025 | $411,895 |
| August 2025 | $411,867 |
| September 2025 | $412,360 |
| October 2025 | $412,644 |
| November 2025 | $412,652 |
| December 2025 | $412,265 |
| January 2026 | $412,296 |
| February 2026 | $412,224 |
The high was $412,836 in March 2025. The low was $411,867 in August 2025. Total swing: $969 — less than a quarter of one percent.
This is a flatlined market. Not a slowly rising market, not a slowly falling market. Just flat. Prices touched the bottom in late summer 2025, drifted up through fall, and have settled back to where they started.
When prices hold this steady this long, it usually means supply and demand are roughly balanced. Sellers aren’t desperate. Buyers aren’t bidding up.
Is Grants Pass a Good Place to Buy in 2026?
The data points to a balanced market, leaning slightly toward buyers.
Prices are flat, not rising — so you’re not racing the clock. Population growth is slow, which keeps demand pressure light. The ZIP spread is narrow, meaning you don’t pay a huge premium to pick a “better” neighborhood.
The case against buying right now: rent is meaningfully cheaper monthly. If you’re not planning to stay 5+ years, the math tilts toward renting. Mortgage costs in the $2,600/month range versus $1,580 average rent is a real gap.
The case for buying: stable prices reduce the risk of buying at the top. With YoY change at -0.1%, you’re not stepping into a falling-knife market either. If you find a home in 97526 under $380K, you’re buying near the floor of the local distribution.
This isn’t a hot market. It’s not a cold one either. Make your decision based on personal timeline and monthly cash flow, not market timing.
Grants Pass Housing Market Outlook for 2026-2027
The 3-month trend tells a simple story: prices have moved less than $100 since December 2025. If the current pace continues, expect Grants Pass to stay in the $410K-$415K range through summer 2026.
The 12-month direction is essentially flat at -0.1%. There’s no momentum signal in either direction. Population growth of 0.6% over four years doesn’t suggest a sudden demand surge.
Watch the spring 2026 data. Spring is typically the strongest selling season, so any meaningful break upward or downward will likely show by May or June. If prices stay in the current band through spring, the market has likely found its equilibrium for this cycle.
Mortgage rates remain the biggest external variable. A meaningful drop could pull more buyers in and push prices up; a rise would extend the flat trend.
Similar Markets in OR
Looking at other Oregon cities for comparison:
- Bend — A faster-growing market with significantly higher prices, suited for buyers prioritizing amenities over affordability.
- Eugene — A larger university town in the Willamette Valley, often comparable on price.
- Salem — Oregon’s capital, with a bigger inventory and steadier growth than Grants Pass.
- Klamath Falls — Often the cheaper Southern Oregon alternative for budget-focused buyers.
- Portland — Oregon’s largest market, where prices and competition both run higher.
Frequently Asked Questions
What is the average home price in Grants Pass?
The average home price in Grants Pass, OR is $412,224 as of February 2026. This figure reflects the Zillow Home Value Index across 4 ZIP codes covering the city.
Are home prices going up or down in Grants Pass?
Prices are essentially flat, down 0.1% year over year. The 12-month range has been a narrow $969 swing — one of the most stable trends in Oregon.
Is it cheaper to rent or buy in Grants Pass?
Renting is cheaper monthly. Average rent runs $1,580 across tracked ZIPs, while owning the median $412K home costs roughly $2,600/month including taxes and insurance. Buying makes more sense if you’re staying 5+ years.
What is the most affordable neighborhood in Grants Pass?
ZIP 97526 is the cheapest at $378,281, about 8% under the city median. It also carries the highest tracked rent at $1,638/month, suggesting strong rental demand in the area.
Methodology
Home values are based on the Zillow Home Value Index (ZHVI), a smoothed measure of typical home values in the 35th to 65th percentile range. Rent estimates use the Zillow Observed Rent Index (ZORI). Population figures come from the U.S. Census Bureau Population Estimates Program (2020-2024 vintage). All datasets are publicly available. Housing data updated 2026-02-28.