Eugene Home Prices: $509K, Down 0.1% — 6 ZIPs Analyzed (2026)
Can you still afford a house in Eugene? At $509,378, the typical home here costs more than the national average but far less than Portland. Prices slipped 0.1% over the past year — barely a rounding error.
Quick answer: The average home price in Eugene, OR is $509,378 as of February 2026, down 0.1% year over year according to Zillow.
Current Home Prices in Eugene
Eugene’s housing market is flat. A year of price movement amounting to negative 0.1% means buyers and sellers are in a standoff.
| Metric | Value |
|---|---|
| Median Home Price | $509,378 |
| Year-over-Year Change | -0.1% |
| Lowest ZIP Price | $395,566 |
| Highest ZIP Price | $606,239 |
| ZIP Codes Tracked | 6 |
| Data as of | February 2026 |
The spread between Eugene’s cheapest and most expensive ZIP codes is $210,673. That’s a 53% gap from bottom to top — significant for a mid-sized Oregon city.
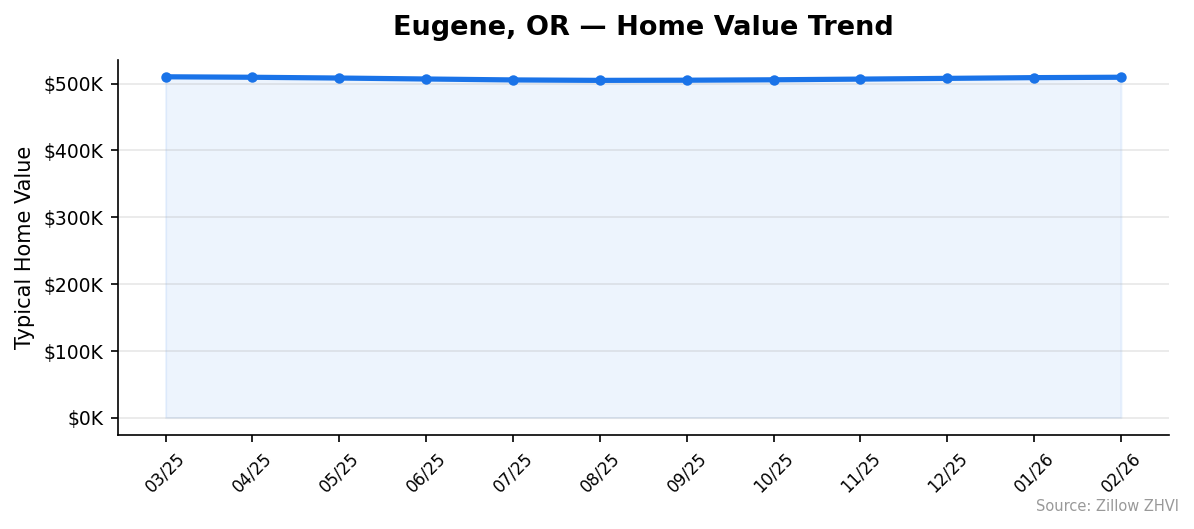
What stands out is how little prices have moved. In February 2025, the average sat at roughly $510,059. Twelve months later, it’s $509,378. The market dipped to $504,697 in August 2025, then climbed back through the fall and winter. That U-shaped pattern suggests seasonal softness, not structural decline.
For buyers, this means no urgency and no discounts. For sellers, it means no windfalls. Eugene is priced at what it’s priced at, and the data says it’s staying there.
Eugene Home Prices by Neighborhood
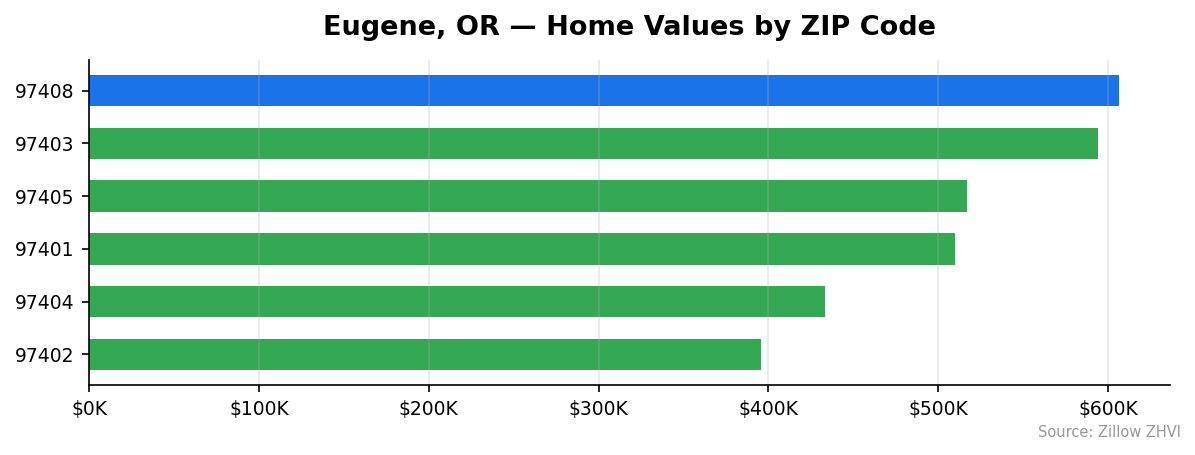
Six ZIP codes cover Eugene proper. The price differences are stark.
| ZIP Code | Median Home Price | Median Rent |
|---|---|---|
| 97402 | $395,566 | $1,738 |
| 97404 | $433,182 | $1,925 |
| 97401 | $509,639 | $1,993 |
| 97405 | $517,268 | $2,337 |
| 97408 | $606,239 | $2,100 |
| 97403 | $594,374 | $2,542 |
Most Expensive
97408 tops the list at $606,239 — 19% above the city median — yet its rent of $2,100 is surprisingly moderate compared to its home values. 97403 follows closely at $594,374 with the highest rents in Eugene at $2,542 per month. 97405 rounds out the top three at $517,268 with rents of $2,337.
Most Affordable
97402 is the clear entry point at $395,566, a full 22% below the city median and the only ZIP under $400K. Rents here are also the lowest at $1,738. 97404 comes in at $433,182 with rents of $1,925 — still 15% below the median. 97401 sits right at the city average — $509,639 — making it the middle ground between affordable west Eugene and the pricier south hills.
Rent vs Buy in Eugene
Renting is cheaper on a monthly basis. Buying builds equity. The usual trade-off — but the numbers matter.
Take the city median of $509,378. With 20% down ($101,876) and a 6.5% mortgage rate on the remaining $407,502, your monthly principal and interest payment runs about $2,577. Add property taxes and insurance, and you’re looking at roughly $3,000 to $3,200 per month.
The median rent across Eugene’s ZIPs ranges from $1,738 to $2,542. Here’s the comparison for each area:
| ZIP Code | Monthly Rent | Est. Mortgage (P&I) | Difference |
|---|---|---|---|
| 97402 | $1,738 | ~$2,000 | +$262/mo to buy |
| 97404 | $1,925 | ~$2,190 | +$265/mo to buy |
| 97401 | $1,993 | ~$2,575 | +$582/mo to buy |
| 97405 | $2,337 | ~$2,614 | +$277/mo to buy |
| 97408 | $2,100 | ~$3,064 | +$964/mo to buy |
| 97403 | $2,542 | ~$3,003 | +$461/mo to buy |
In every ZIP code, buying costs more per month. The gap is smallest in 97402 and 97405, where rents are closer to mortgage payments. The biggest disconnect is 97408 — high home prices but relatively restrained rents.
If you’re staying five-plus years, buying still makes sense for equity. Short-term? Renting wins on cash flow.
Population Growth and Migration
Eugene isn’t booming. The city’s population grew just 0.2% from 2020 to 2024 — from 178,436 to 178,786. That’s 350 net residents over four years.
| Year | Population |
|---|---|
| 2020 | 178,436 |
| 2021 | 180,086 |
| 2022 | 182,053 |
| 2023 | 178,686 |
| 2024 | 178,786 |
The trend is odd. Eugene gained over 3,600 residents from 2020 to 2022, then lost 3,367 in a single year. The 2023 drop wiped out nearly all prior growth. The city stabilized in 2024 with a gain of just 100 people.
Compare that to other Oregon cities:
| City | 2024 Population | 4-Year Growth |
|---|---|---|
| Bend | 106,926 | +7.3% |
| Corvallis | 61,993 | +6.3% |
| Tigard | 57,301 | +4.1% |
| Hillsboro | 110,337 | +3.0% |
| Salem | 180,406 | +2.5% |
| Eugene | 178,786 | +0.2% |
Eugene is the slowest-growing city on this list. Bend’s 7.3% growth rate dwarfs it. Even Salem — a comparable-sized city — grew 12 times faster.
Flat population means flat housing demand. This aligns with the near-zero price change. Eugene isn’t attracting the kind of migration that drives prices up in Bend or Boise.
Eugene Housing Market Trends
Here’s the full 12-month price trajectory, from March 2025 through February 2026.
| Month | Average Price | Low ZIP | High ZIP |
|---|---|---|---|
| Mar 2025 | $510,059 | $395,275 | $606,483 |
| Apr 2025 | $509,348 | $394,245 | $606,330 |
| May 2025 | $508,186 | $393,437 | $605,489 |
| Jun 2025 | $506,753 | $392,747 | $604,102 |
| Jul 2025 | $505,361 | $392,442 | $602,319 |
| Aug 2025 | $504,697 | $392,370 | $601,202 |
| Sep 2025 | $504,949 | $392,651 | $601,399 |
| Oct 2025 | $505,568 | $392,719 | $602,699 |
| Nov 2025 | $506,599 | $393,046 | $604,280 |
| Dec 2025 | $507,690 | $393,794 | $605,346 |
| Jan 2026 | $508,800 | $394,779 | $605,874 |
| Feb 2026 | $509,378 | $395,566 | $606,239 |
The pattern is clear. Prices fell from March through August 2025, losing about $5,362 (1.1%) over six months. Then they reversed, gaining $4,681 from the August low through February 2026.
The trough-to-peak recovery almost perfectly offset the spring decline. Eugene ended the year within $681 of where it started — a textbook flat market.
Both the cheapest and most expensive ZIPs followed the same pattern. No neighborhood broke away from the pack.
Is Eugene a Good Place to Buy in 2026?
The data points to a balanced market. Prices aren’t rising fast enough to create urgency, and they aren’t falling fast enough to reward waiting.
Here’s what the numbers tell you:
For buyers: You have time. A 0.1% annual decline means you’re not losing ground by shopping carefully. The spread between ZIPs is wide — $210K from cheapest to most expensive — so neighborhood selection matters more than timing.
For sellers: Don’t expect bidding wars. Flat prices and flat population growth mean your home is worth roughly what it was a year ago. Price it at market, not above.
For investors: Rent yields vary. In 97402, a $396K home renting at $1,738/month gives you a better ratio than 97408’s $606K home at $2,100/month. Run the numbers ZIP by ZIP.
Eugene’s university-town economy provides stability. It won’t spike like Bend, but it won’t crash either. If you’re buying a home to live in for five or more years, the math works. If you’re speculating on short-term appreciation, look elsewhere.
Eugene Housing Market Outlook for 2026-2027
The six-month trend from August 2025 to February 2026 shows steady monthly gains averaging about $780 per month. If that pace continues, Eugene prices could reach $514,000 to $518,000 by mid-2026 before the typical summer softening.
But here’s the catch: the same seasonal dip happened in 2025. Prices peaked in spring, fell through summer, and recovered in fall. The data suggests Eugene may repeat that cycle.
The 3-month trend from December through February shows accelerating gains — $1,110, then $578. Month-over-month changes remain small. Nothing in the data points to a breakout in either direction.
Expect more of the same: a flat market oscillating within a narrow band. Barring a major shift in mortgage rates or local job growth, Eugene prices will likely stay within 1-2% of current levels through 2027.
Similar Markets in OR
If you’re shopping around Oregon, here are other cities to compare:
- Portland — Oregon’s largest market with more inventory and higher price variation than Eugene.
- Salem — Similar population to Eugene with 2.5% growth, which may support stronger price trends.
- Bend — Growing fast at 7.3%, but expect higher prices and more competition.
- Beaverton — Portland suburb with a different price profile and tech-sector demand.
- Grants Pass — Southern Oregon alternative that typically runs cheaper than Eugene.
Frequently Asked Questions
What is the average home price in Eugene?
The average home price in Eugene is $509,378 as of February 2026. Prices range from $395,566 in ZIP code 97402 to $606,239 in ZIP code 97408, a spread of over $210,000 across the city’s six tracked neighborhoods.
Are home prices going up or down in Eugene?
Prices are essentially flat, down 0.1% year over year. They dipped to a low of $504,697 in August 2025 before recovering through the winter months. The market has been oscillating within a narrow $5,000 band for the past year.
Is it cheaper to rent or buy in Eugene?
Renting is cheaper on a monthly basis in every Eugene ZIP code. The median rent ranges from $1,738 to $2,542, while estimated mortgage payments (principal and interest alone) range from about $2,000 to $3,064. The gap is smallest in west Eugene (97402) at roughly $262 per month.
What is the most affordable neighborhood in Eugene?
ZIP code 97402 in west Eugene is the most affordable at $395,566 — 22% below the city median. It also has the lowest rents at $1,738 per month. The next cheapest option is 97404 at $433,182.
Methodology
Home values are based on the Zillow Home Value Index (ZHVI), a smoothed measure of typical home values in the 35th to 65th percentile range. Rent estimates use the Zillow Observed Rent Index (ZORI). Population figures come from the U.S. Census Bureau Population Estimates Program (2020-2024 vintage). All datasets are publicly available. Housing data updated 2026-02-28.