Green Bay Home Prices: $287K, Up 5.5% — 4 ZIPs Analyzed (2026)
$286,763. That’s what a typical Green Bay home was worth in February 2026, up 5.5% from a year earlier. Prices have climbed every single month for the past year, and the gap between the cheapest and priciest ZIP code now exceeds $138,000.
Quick answer: The average home price in Green Bay, WI is $286,763 as of February 2026, up 5.5% year over year according to Zillow.
Current Home Prices in Green Bay
The Green Bay market sits in the middle of the Wisconsin pack — well below Madison, well above the rural counties to the north. Here is the snapshot for February 2026.
| Metric | Value |
|---|---|
| Median home value | $286,763 |
| Year-over-year change | +5.5% |
| Cheapest ZIP | $238,963 (54303) |
| Most expensive ZIP | $377,079 (54311) |
| Price spread | $138,116 |
| ZIP codes tracked | 4 |
| Reporting month | February 2026 |
A 5.5% annual gain is meaningful in a city with shrinking population. Demand is not coming from new arrivals. It’s coming from existing residents trading up, regional buyers from the Fox Valley, and limited new construction.
The $138,000 spread between 54311 and 54303 tells you the market is uneven. Buyers can pick a ZIP and get a home that costs roughly 60% of what the same square footage would cost a few miles east. That kind of split is unusual for a city this size.
You won’t find the boom-bust pattern here that hit Sun Belt cities. Green Bay’s gains have been linear — small, consistent monthly increases for 12 straight months.
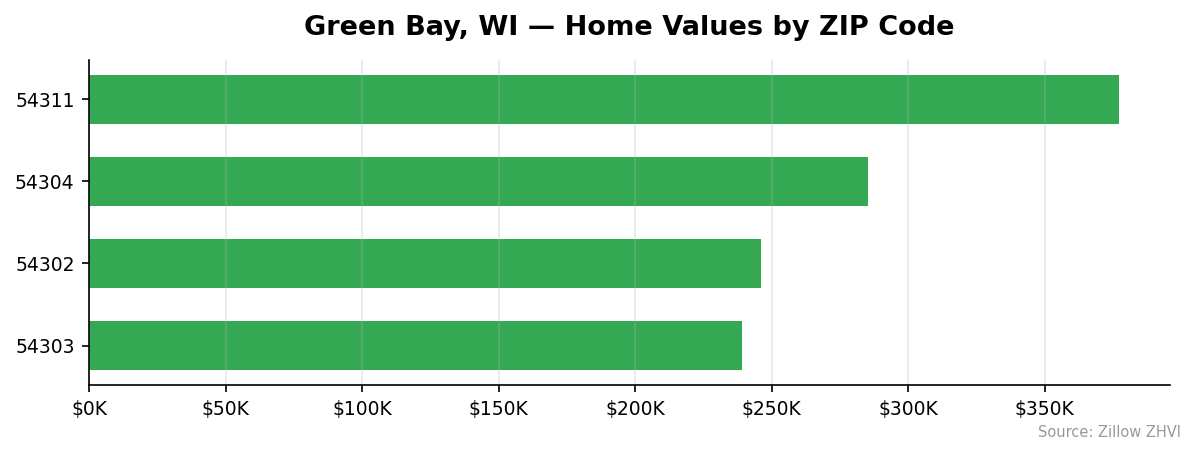
Green Bay Home Prices by Neighborhood
Four ZIP codes carry the data for Green Bay. Each one tells a different story.
| ZIP Code | Median Home Value | vs City Avg |
|---|---|---|
| 54311 | $377,079 | +31.5% |
| 54304 | $285,114 | -0.6% |
| 54302 | $245,896 | -14.3% |
| 54303 | $238,963 | -16.7% |
Most Expensive
54311 leads at $377,079, more than $90,000 above the next ZIP. This is the east-side and Bellevue-adjacent area where newer construction and larger lots push the median.
54304 sits at $285,114, almost exactly at the city average. It pulls double duty as a residential and commercial corridor on the west side, so housing stock is mixed.
54302 comes in third at $245,896. The area covers parts of the east side closer to the bay, with older housing that hasn’t seen the same price acceleration.
Most Affordable
54303 is the cheapest at $238,963 — 16.7% below the city average. It’s the entry point for first-time buyers in Green Bay.
54302 at $245,896 offers slightly older homes with rents averaging $926 a month, the lowest of any tracked ZIP.
54304 at $285,114 splits the difference between the affordable east-side options and the premium 54311 area.
Rent vs Buy in Green Bay
Rent data is available for three of the four ZIPs. Here’s what tenants are paying.
| ZIP Code | Median Rent | Annual Rent |
|---|---|---|
| 54304 | $1,662 | $19,944 |
| 54303 | $1,141 | $13,692 |
| 54302 | $926 | $11,112 |
The math favors renting in the short term, especially in 54302. At $926 a month, a tenant pays $11,112 a year — well under the carrying cost of even the cheapest ZIP’s mortgage when you add property taxes, insurance, and maintenance to a typical loan payment on a $238,963 home.
54304 is closer. At $1,662 in rent versus a $285,114 home value, the buy-rent gap narrows once you account for principal paydown and the 5.5% annual appreciation Green Bay has been delivering.
If you plan to stay five-plus years and prices keep climbing at the current pace, buying in 54302 or 54303 likely wins. Stay under three years, and renting is the safer bet — especially given Green Bay’s flat-to-shrinking population.
Population Growth and Migration
Green Bay’s population is going in the wrong direction. The city had 107,299 residents in 2020 and 106,311 in 2024 — a 0.9% drop over four years.
| Year | Population |
|---|---|
| 2020 | 107,299 |
| 2021 | 105,586 |
| 2022 | 105,727 |
| 2023 | 106,210 |
| 2024 | 106,311 |
The trend bottomed in 2021 and has slowly clawed back, but the city is still down nearly 1,000 residents from its 2020 baseline.
Compare that to other Wisconsin cities:
| City | 2024 Population | 4-Yr Growth |
|---|---|---|
| Madison | 285,300 | +3.8% |
| Eau Claire | 72,331 | +4.1% |
| Janesville | 66,428 | +1.2% |
| Waukesha | 71,461 | +0.5% |
| Oshkosh | 67,242 | +0.5% |
| Green Bay | 106,311 | -0.9% |
Green Bay is the only city in this group losing residents. That matters for housing demand. The 5.5% annual price gain is happening despite population loss, not because of growth — which suggests supply constraints are doing the work.
Green Bay Housing Market Trends
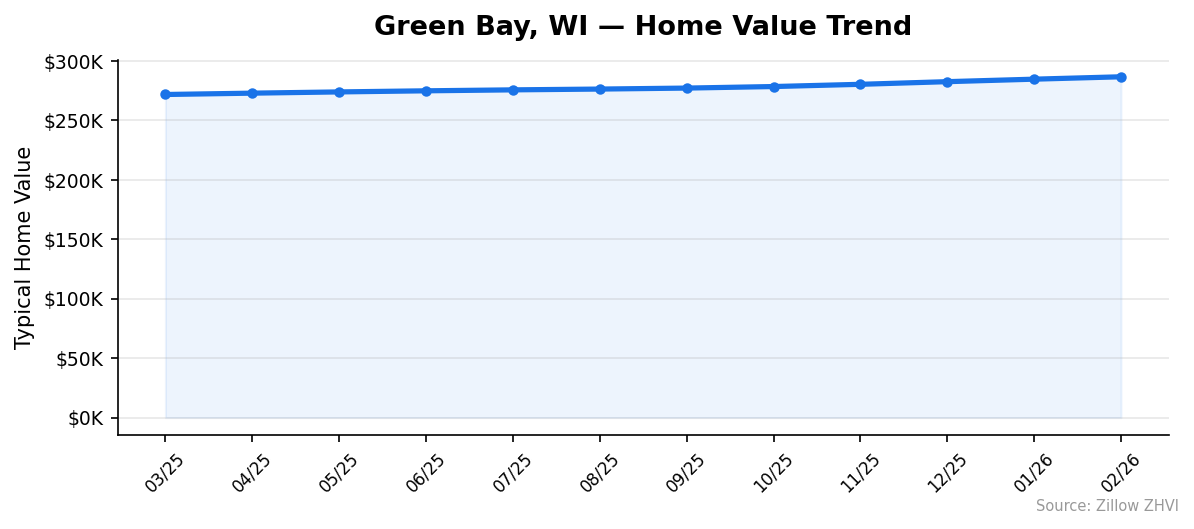
Twelve months of monthly data show a market with no down months.
| Month | Median Value |
|---|---|
| March 2025 | $271,862 |
| April 2025 | $272,993 |
| May 2025 | $274,035 |
| June 2025 | $274,962 |
| July 2025 | $275,767 |
| August 2025 | $276,435 |
| September 2025 | $277,259 |
| October 2025 | $278,558 |
| November 2025 | $280,430 |
| December 2025 | $282,663 |
| January 2026 | $284,759 |
| February 2026 | $286,763 |
Prices added $14,901 over those 12 months — about $1,242 per month on average. The pace picked up in late 2025: November through February alone added more than $8,000.
There is no sign of a slowdown in this data. Each month has been higher than the last for a full year.
Is Green Bay a Good Place to Buy in 2026?
This is a seller’s market based on the price action. Twelve straight months of gains and a 5.5% annual rise put sellers in the stronger position.
For buyers, the case depends on the ZIP. 54303 at $238,963 is one of the cheapest entry points in any midsize Wisconsin city. If you want a starter home and plan to stay, the math is favorable.
54311 at $377,079 is a different conversation. You’re paying a premium for newer stock. If price growth slows, that ZIP has the most to lose because the gap to the city average is widest.
The shrinking population is the wild card. A market that gains 5.5% while losing residents is running on supply constraints, not demand. If new construction picks up or sellers flood the market, those gains could compress quickly.
Green Bay Housing Market Outlook for 2026-2027
The 3-month trend from December 2025 through February 2026 added $4,100 to the median — roughly $1,367 per month. If the current pace continues, Green Bay could approach $295,000 by mid-2026 and push past $300,000 by late summer.
The acceleration in late 2025 is the key signal. Monthly gains were running near $1,000 through summer 2025 and jumped above $2,000 in January and February 2026.
That said, Green Bay’s population has been flat to negative for five years. Sustained 5%+ price growth in a shrinking city is unusual and depends on supply staying tight. If listings rise or mortgage rates push higher, the trend could flatten.
The 6-month direction looks up. Beyond that, watch the monthly print — any month that comes in below the prior month would be the first negative reading in over a year and a meaningful signal.
Similar Markets in WI
- Appleton — closest comparable city in the Fox Valley, similar size and economy
- Oshkosh — smaller, with the same flat-growth profile and lower price points
- Madison — the high end of Wisconsin pricing, useful as a benchmark
- Milwaukee — larger metro with more ZIP variation and a different rental market
- Fond du Lac — cheaper alternative south of Green Bay for buyers priced out of 54311
Frequently Asked Questions
What is the average home price in Green Bay?
The average home price in Green Bay, WI is $286,763 as of February 2026. This figure is the median Zillow Home Value Index across four ZIP codes inside the city.
Are home prices going up or down in Green Bay?
Prices are up 5.5% year over year. Green Bay has posted 12 straight months of price gains, with the pace accelerating in late 2025 and early 2026.
Is it cheaper to rent or buy in Green Bay?
Renting is cheaper month-to-month in every tracked ZIP, especially 54302 where rent averages $926. Buying becomes the better choice if you stay five-plus years and prices keep climbing at the current 5.5% annual pace.
What is the most affordable neighborhood in Green Bay?
ZIP 54303 is the cheapest at $238,963 — about 17% below the city average. It is the entry point for first-time buyers, with rent in the area averaging $1,141.
Methodology
Home values are based on the Zillow Home Value Index (ZHVI), a smoothed measure of typical home values in the 35th to 65th percentile range. Rent estimates use the Zillow Observed Rent Index (ZORI). Population figures come from the U.S. Census Bureau Population Estimates Program (2020-2024 vintage). All datasets are publicly available. Housing data updated 2026-02-28.