Hayward Home Prices: $932K, Down 5.3% — 4 ZIPs Analyzed (2026)
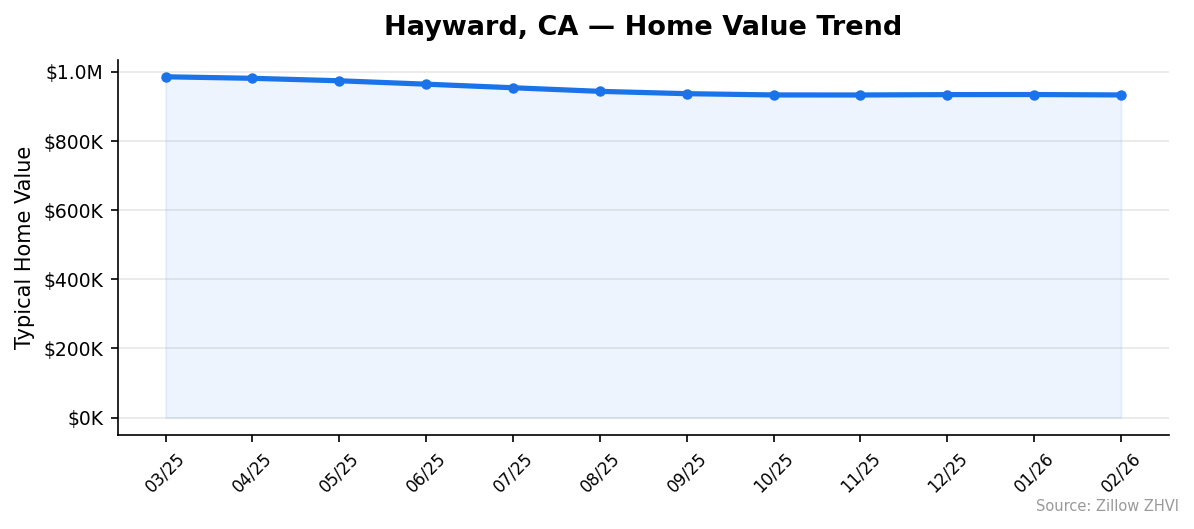
Prices dropped for the tenth straight month in Hayward. The typical home here now costs $932,473 — down 5.3% from a year ago and more than $52,000 below the March 2025 peak. For Bay Area buyers who’ve been priced out, the math is starting to shift.
Quick answer: The average home price in Hayward, CA is $932,473 as of February 2026, down 5.3% year over year according to Zillow.
Current Home Prices in Hayward
| Metric | Value |
|---|---|
| Median Home Value | $932,473 |
| Year-over-Year Change | -5.3% |
| Lowest Price (by ZIP) | $775,500 |
| Highest Price (by ZIP) | $1,229,270 |
| Number of ZIP Codes | 4 |
| Data as of | February 2026 |
Hayward sits in the San Francisco-Oakland-Berkeley metro, one of the most expensive housing markets in the country. But the city is pulling back from its highs. A year ago, the average home in Hayward was worth roughly $985,000. Today it’s $932,473.
That 5.3% decline translates to about $52,000 in lost value over twelve months. The drop hasn’t been sudden — it’s been a slow grind. Prices peaked in March-April 2025 near $985,000, then fell every single month through February 2026.
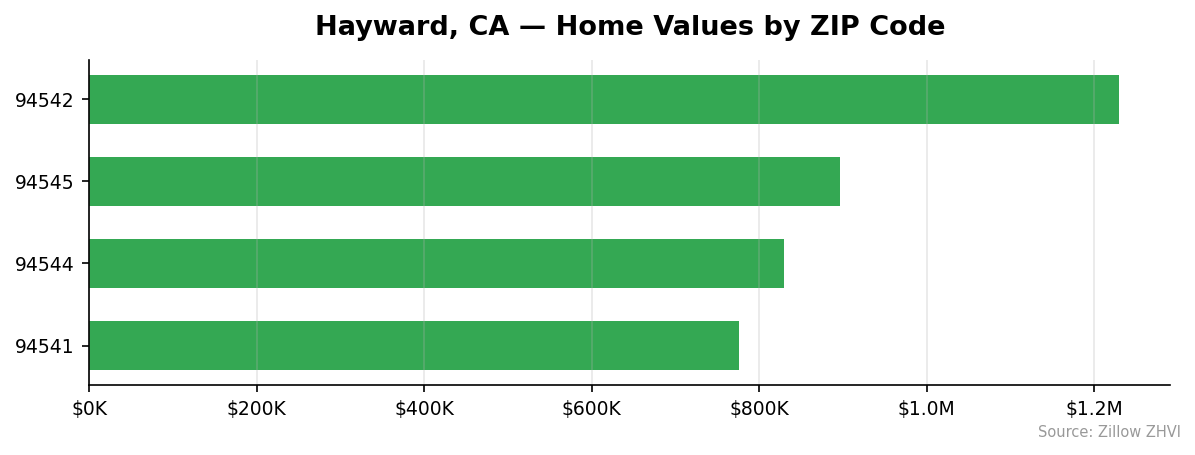
The spread between the cheapest and most expensive ZIP codes is enormous. The gap between $775,500 and $1,229,270 means your experience in Hayward depends heavily on which neighborhood you’re looking at. A buyer in 94541 faces a completely different market than one in 94542.
Hayward Home Prices by Neighborhood
| ZIP Code | Median Home Value | Median Rent |
|---|---|---|
| 94542 | $1,229,270 | $2,380/mo |
| 94545 | $896,230 | $2,578/mo |
| 94544 | $828,891 | $2,609/mo |
| 94541 | $775,500 | $2,537/mo |
Most Expensive
94542 leads Hayward at $1,229,270 — 32% above the city average. Despite having the highest home values, this ZIP has the lowest rent in the city at $2,380 per month, which suggests a neighborhood of owner-occupants rather than renters.
Most Affordable
94541 is the entry point to Hayward homeownership at $775,500, roughly 17% below the city average. Rent here runs $2,537 per month. 94544 comes in next at $828,891 with the highest rents in the city at $2,609 per month, signaling strong rental demand in this area.
One oddity in the data: the most affordable ZIPs have the highest rents, while the most expensive ZIP has the lowest rent. That disconnect tells you something about who lives where. The pricier 94542 area skews toward homeowners. The more affordable areas have heavier renter populations competing for units.
Rent vs Buy in Hayward
| ZIP Code | Median Rent | Median Home Value | Price-to-Rent Ratio |
|---|---|---|---|
| 94541 | $2,537/mo | $775,500 | 25.5x |
| 94542 | $2,380/mo | $1,229,270 | 43.1x |
| 94544 | $2,609/mo | $828,891 | 26.5x |
| 94545 | $2,578/mo | $896,230 | 29.0x |
The average rent across Hayward’s four ZIP codes is approximately $2,526 per month. That’s a lot of money — but buying is far more expensive on a monthly basis.
A 20% down payment on a $932,473 home means $186,495 upfront and a loan of about $746,000. At current mortgage rates near 7%, that’s roughly $4,960 per month in principal and interest alone — before property taxes, insurance, and maintenance.
You’d pay nearly double each month to own instead of rent. The price-to-rent ratio across most of Hayward hovers around 26-29x, well above the 15-20x range where buying typically makes financial sense. ZIP 94542 is extreme at 43x.
Renting is the better short-term financial play right now, especially with prices still falling. If you’re buying, you need to be in it for the long haul.
Population Growth and Migration
| Year | Population |
|---|---|
| 2020 | 162,726 |
| 2021 | 158,350 |
| 2022 | 157,119 |
| 2023 | 157,375 |
| 2024 | 158,440 |
Hayward lost 4,286 residents between 2020 and 2024, a 2.6% decline. The sharpest drop came in 2020-2021 when the city shed over 4,300 people in a single year — likely pandemic-driven outmigration from the Bay Area.
The bleeding has mostly stopped. Population ticked up slightly in 2023 and again in 2024, suggesting Hayward may have found a floor. But the city hasn’t come close to recovering its 2020 count.
| City | 2024 Population | 4-Year Growth |
|---|---|---|
| Bakersfield | 417,468 | +3.0% |
| Sacramento | 535,798 | +1.9% |
| San Diego | 1,404,452 | +1.4% |
| Fresno | 550,105 | +1.4% |
| Oakland | 443,554 | +0.6% |
| Hayward | 158,440 | -2.6% |
Compared to other California cities, Hayward is an outlier. Every city in this comparison gained residents. Bakersfield grew 3.0%. Even neighboring Oakland managed 0.6% growth. Hayward’s population loss puts downward pressure on housing demand — one factor behind falling prices.
Hayward Housing Market Trends
| Month | Average Value | Low | High |
|---|---|---|---|
| Mar 2025 | $984,921 | $814,427 | $1,277,235 |
| Apr 2025 | $980,544 | $810,465 | $1,275,402 |
| May 2025 | $973,427 | $804,874 | $1,268,908 |
| Jun 2025 | $963,572 | $797,598 | $1,257,181 |
| Jul 2025 | $953,236 | $791,158 | $1,243,878 |
| Aug 2025 | $942,847 | $784,554 | $1,230,341 |
| Sep 2025 | $936,113 | $780,371 | $1,223,364 |
| Oct 2025 | $932,480 | $777,443 | $1,221,003 |
| Nov 2025 | $932,334 | $776,858 | $1,223,586 |
| Dec 2025 | $933,377 | $777,234 | $1,226,405 |
| Jan 2026 | $933,652 | $776,580 | $1,228,946 |
| Feb 2026 | $932,473 | $775,500 | $1,229,270 |
The trend tells two stories. From March through October 2025, prices dropped steeply — about $52,000 in seven months. Then the decline almost stopped. November through February saw prices hover in a tight band between $932,334 and $933,652.
That flattening is significant. The market may be finding a floor near $932,000. The low end (94541) has continued drifting down slightly, from $777,443 in October to $775,500 in February. But the high end (94542) actually ticked up from $1,221,003 to $1,229,270 over the same period.
The bottom and top of the market are moving in opposite directions. Affordable areas keep getting slightly cheaper. Expensive areas are recovering.
Is Hayward a Good Place to Buy in 2026?
The numbers favor buyers right now. Prices are down 5.3% year over year, the population is shrinking, and the monthly cost of owning is nearly double that of renting. If you’re looking for a deal in the Bay Area, Hayward is giving ground.
But context matters. Even after a $52,000 drop, the median home still costs $932,473. You need roughly $186,000 for a down payment. Monthly carrying costs will run north of $5,500 when you add taxes and insurance.
The four-month flattening from November through February suggests the rapid decline is over. You’re not likely to catch a falling knife much further — but you’re also not buying into a rising market.
If you can afford the entry price, this is the most buyer-friendly Hayward has been since prices peaked. First-time buyers should focus on 94541 and 94544 where homes start under $830,000. Move-up buyers eyeing the hills of 94542 should note that segment is already recovering.
Hayward Housing Market Outlook for 2026-2027
The 12-month trend shows a clear pattern: sharp decline, then stabilization. Prices dropped roughly $52,000 from March to October 2025, then moved sideways for four months.
If the current pace continues, expect Hayward home values to hold near $930,000 through spring 2026. The typical seasonal bump — when more buyers enter the market in spring and summer — could push prices slightly higher. But with population still below 2020 levels and the price-to-rent ratio stretched well above historical norms, any gains would likely be modest.
The 3-month trend from December through February is essentially flat. That suggests stability, not a rebound. Sellers hoping for a return to the $985,000 peak shouldn’t hold their breath in the near term.
Similar Markets in CA
If you’re exploring alternatives to Hayward, several other California cities offer different price points:
- Los Angeles — A much larger market with wide neighborhood-by-neighborhood variation in pricing.
- Fresno — Central Valley option with significantly lower prices and 1.4% population growth.
- Bakersfield — The fastest-growing city on this list at 3.0%, with prices far below Bay Area levels.
- San Diego — Coastal California living with a growing population of 1.4 million.
- Long Beach — Southern California alternative in the LA metro area.
Frequently Asked Questions
What is the average home price in Hayward?
The average home price in Hayward is $932,473 as of February 2026. Prices vary widely by neighborhood, from $775,500 in ZIP code 94541 to $1,229,270 in 94542. The city-wide median has dropped over $52,000 from its March 2025 peak.
Are home prices going up or down in Hayward?
Home prices in Hayward are down 5.3% compared to a year ago. Prices fell every month from March 2025 through February 2026, though the rate of decline slowed sharply after October 2025. The last four months show near-flat pricing around $932,000-$934,000.
Is it cheaper to rent or buy in Hayward?
Renting is substantially cheaper. The average rent across Hayward runs about $2,526 per month. A mortgage payment on the median-priced home with 20% down at 7% interest would cost roughly $4,960 per month — nearly double — before taxes and insurance. The price-to-rent ratio of 26-43x (depending on ZIP) strongly favors renting in the short term.
What is the most affordable neighborhood in Hayward?
ZIP code 94541 is the most affordable area in Hayward with a median home value of $775,500. That’s 17% below the city-wide average. Rent in 94541 averages $2,537 per month. The next most affordable is 94544 at $828,891.
Is Hayward growing or shrinking?
Hayward is shrinking. The city’s population fell from 162,726 in 2020 to 158,440 in 2024, a 2.6% decline. The sharpest drop occurred between 2020 and 2022, but the population has stabilized and ticked up slightly in 2023 and 2024.
Methodology
Home values are based on the Zillow Home Value Index (ZHVI), a smoothed measure of typical home values in the 35th to 65th percentile range. Rent estimates use the Zillow Observed Rent Index (ZORI). Population figures come from the U.S. Census Bureau Population Estimates Program (2020-2024 vintage). All datasets are publicly available. Housing data updated 2026-02-28.