Honolulu Home Prices: $871K, Up 0.6% — 11 ZIPs Analyzed (2026)
$871K. That’s what a typical home costs in Honolulu as of February 2026. Prices inched up 0.6% over the past year — barely keeping pace with inflation. Across 11 ZIP codes, values range from under $470K to nearly $1.8 million.
Quick answer: The average home price in Honolulu, HI is $870,554 as of February 2026, up 0.6% year over year according to Zillow.
Current Home Prices in Honolulu
| Metric | Value |
|---|---|
| Median Home Value | $870,554 |
| Year-over-Year Change | +0.6% |
| Lowest ZIP Value | $469,716 |
| Highest ZIP Value | $1,773,348 |
| ZIP Codes Tracked | 11 |
| Data as of | February 2026 |
A 0.6% annual gain barely registers. In dollar terms, the typical Honolulu home gained roughly $5,200 over the past year. That’s pocket change on an $871K property.
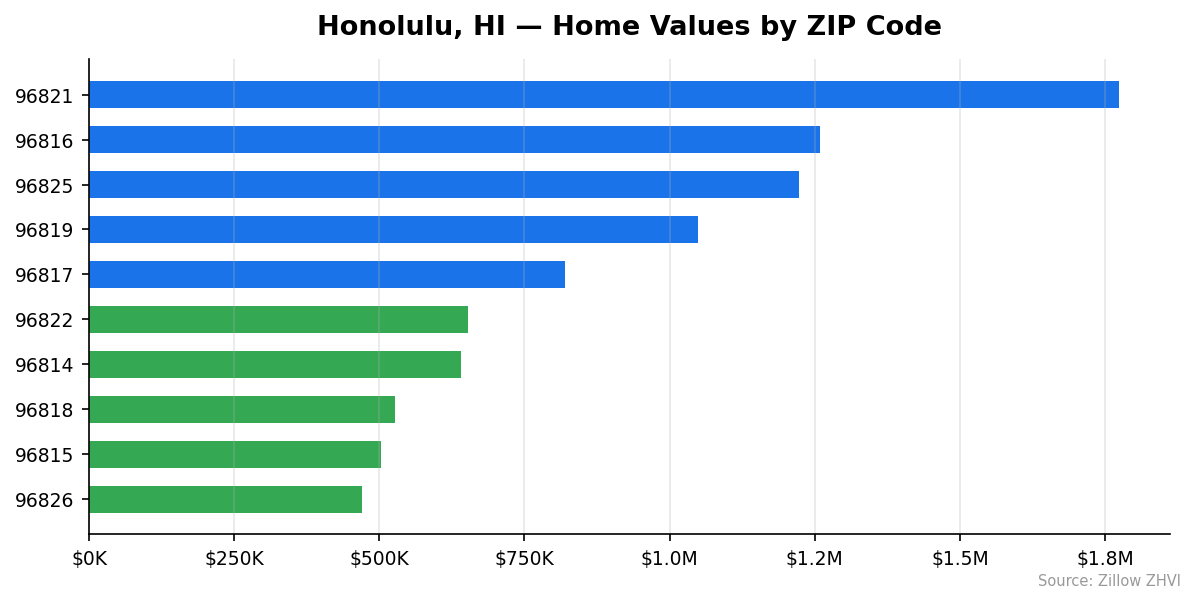
The spread between the cheapest and most expensive ZIP codes is $1.3 million. That gap tells you Honolulu isn’t one market — it’s several stacked on top of each other. A buyer with $500K has exactly two ZIP codes to choose from. A buyer with $1.2M has options across nine.
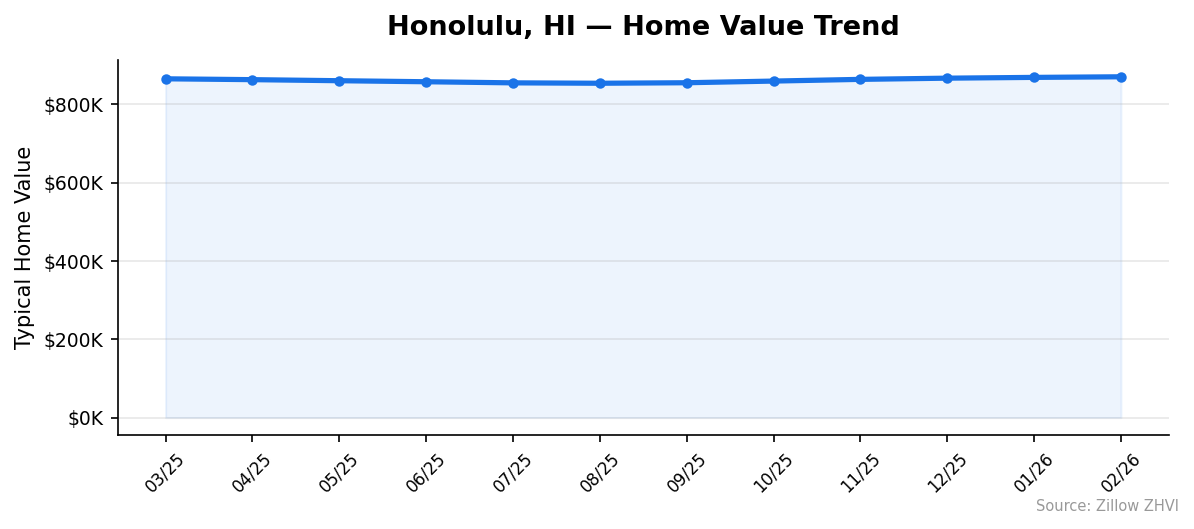
One year ago, the median sat near $865K. The path from there to $871K wasn’t a straight line. Prices actually softened through mid-2025, bottoming around $854K in August before reversing course. The last six months have been a slow, steady climb back.
Honolulu Home Prices by Neighborhood
| ZIP Code | Typical Home Value | Avg. Monthly Rent |
|---|---|---|
| 96821 | $1,773,348 | N/A |
| 96816 | $1,259,573 | $2,900 |
| 96825 | $1,223,372 | $3,695 |
| 96819 | $1,048,973 | $2,673 |
| 96817 | $819,265 | $2,356 |
| 96813 | $659,397 | $2,709 |
| 96822 | $652,634 | $1,963 |
| 96814 | $640,244 | $2,974 |
| 96818 | $526,469 | $2,566 |
| 96815 | $503,105 | $2,820 |
| 96826 | $469,716 | $1,897 |
Most Expensive ZIPs
96821 tops the list at $1,773,348 — more than double the city median and the only ZIP above $1.5M. Rent data isn’t available here, suggesting a market dominated by owners rather than renters.
96816 comes in at $1,259,573 with relatively moderate rents of $2,900/month, a low ratio for a million-dollar-plus ZIP. 96825 is close behind at $1,223,372 but commands the highest rents in the city at $3,695/month.
Most Affordable ZIPs
96826 is the entry point to Honolulu homeownership at $469,716 — 46% below the city median. Rents here are the lowest in the city at $1,897/month. 96815 sits at $503,105 with rents of $2,820, a rent-to-price ratio that favors renters heavily. 96818 rounds out the bottom three at $526,469.
Rent vs Buy in Honolulu
Renting wins on monthly cash flow. It’s not even close.
Take the city median of $870,554. Put 20% down ($174,111) and finance the rest at 7%. Your monthly mortgage payment lands around $4,630 — principal and interest only, before property taxes, insurance, or HOA fees.
Now look at rents. The most expensive ZIP (96825) averages $3,695/month. The cheapest (96826) is $1,897. Even the priciest rent in Honolulu costs less than a mortgage on the median home.
| ZIP Code | Home Value | Est. Mortgage (P&I) | Avg. Rent | Monthly Difference |
|---|---|---|---|---|
| 96826 | $469,716 | ~$2,500 | $1,897 | Rent saves ~$603 |
| 96815 | $503,105 | ~$2,677 | $2,820 | Buy saves ~$143 |
| 96817 | $819,265 | ~$4,361 | $2,356 | Rent saves ~$2,005 |
| 96819 | $1,048,973 | ~$5,584 | $2,673 | Rent saves ~$2,911 |
Mortgage estimates assume 20% down and a 7% rate. In most ZIP codes, renting saves you $600 to $2,900 per month. The one exception is 96815, where rents run slightly higher than a mortgage payment — an oddity likely driven by short-term rental demand in the Waikiki area.
The buy case rests on appreciation and equity building. At 0.6% annual growth, you’d gain about $5,200 in equity per year on the median home. That doesn’t offset the monthly cost gap for most buyers.
Honolulu Housing Market Trends
| Month | Avg. Home Value | Min ZIP | Max ZIP |
|---|---|---|---|
| Feb 2026 | $870,554 | $469,716 | $1,773,348 |
| Jan 2026 | $869,022 | $470,584 | $1,767,578 |
| Dec 2025 | $867,025 | $471,149 | $1,763,377 |
| Nov 2025 | $863,964 | $472,086 | $1,756,793 |
| Oct 2025 | $859,607 | $472,650 | $1,747,641 |
| Sep 2025 | $855,344 | $472,595 | $1,738,355 |
| Aug 2025 | $854,047 | $473,652 | $1,734,025 |
| Jul 2025 | $855,063 | $474,975 | $1,733,121 |
| Jun 2025 | $857,888 | $477,488 | $1,734,317 |
| May 2025 | $860,517 | $479,834 | $1,733,830 |
| Apr 2025 | $863,236 | $483,226 | $1,728,905 |
| Mar 2025 | $865,394 | $486,376 | $1,720,249 |
Two stories are buried in this table.
The city average dipped from $865K in March 2025 to $854K in August — a $11,347 drop over five months. Then it reversed. From August to February, prices climbed $16,507. The net result: a $5,160 gain over 12 months.
The bottom of the market moved in the opposite direction. The cheapest ZIP fell from $486K in March to $470K in February — a steady decline even as the city average rose. The most expensive ZIP, meanwhile, surged from $1.72M to $1.77M. The gap between Honolulu’s cheapest and priciest neighborhoods widened by $69,000 in one year.
Is Honolulu a Good Place to Buy in 2026?
The numbers paint a neutral picture. Neither a buyer’s market nor a seller’s market — just a flat one.
At 0.6% annual growth, you’re not building meaningful equity through appreciation. A $871K home gains $5,200 per year at that rate. After closing costs and maintenance, short-term buyers could easily lose money.
But Honolulu has a structural advantage: limited land. You can’t build new subdivisions on an island the way you can in Phoenix or Dallas. That floor under prices is real.
If you’re buying to live in for 7+ years, the math gets more favorable. You lock in a fixed housing cost while rents continue to float. If you need flexibility or plan to move within three to five years, renting is the stronger financial play at current prices and rates.
The three ZIPs under $530K — 96826, 96815, and 96818 — are the most accessible entry points. They’re 40-46% below the city median.
Honolulu Housing Market Outlook for 2026-2027
The six-month upward trend from August 2025 to February 2026 shows consistent month-over-month gains of $1,500 to $4,300. If that pace continues, the median could push past $880K by mid-2026.
But context matters. The first half of 2025 saw prices fall. Honolulu’s market has oscillated in a narrow $854K-$871K band for a full year. The trend suggests sideways movement, not a breakout in either direction.
The high-end market (96821) is the outlier. That ZIP added $53,000 in value over 12 months while the cheapest ZIP lost $17,000. Expect this divergence to continue. Premium areas absorb demand from mainland buyers. Entry-level ZIPs face pressure from high mortgage rates.
A reasonable expectation for late 2026: the city median stays between $860K and $890K.
Similar Markets in HI
Hawaii’s housing data is limited to a small number of tracked cities. Buyers considering Honolulu may also want to look at:
- Kilauea — a smaller market on Kauai for buyers who want island living outside of Oahu’s urban core.
Frequently Asked Questions
What is the average home price in Honolulu?
The average home price in Honolulu is $870,554 as of February 2026. That figure represents the typical home value across all 11 tracked ZIP codes. Individual neighborhoods range from $469,716 (96826) to $1,773,348 (96821).
Are home prices going up or down in Honolulu?
Prices are up 0.6% year over year. That masks a mid-year dip — values fell to $854,047 in August 2025 before recovering over the following six months. The overall trend is flat with a slight upward tilt.
Is it cheaper to rent or buy in Honolulu?
Renting is cheaper in almost every ZIP code. A mortgage on the median home costs roughly $4,630/month (20% down, 7% rate), while rents range from $1,897 to $3,695. Only in ZIP 96815 do rents slightly exceed the estimated mortgage payment.
What is the most affordable neighborhood in Honolulu?
ZIP code 96826 has the lowest typical home value at $469,716 — 46% below the city median. It also has the lowest average rent at $1,897/month. ZIP 96815 ($503,105) and ZIP 96818 ($526,469) are the next most affordable options.
Methodology
Home values are based on the Zillow Home Value Index (ZHVI), a smoothed measure of typical home values in the 35th to 65th percentile range. Rent estimates use the Zillow Observed Rent Index (ZORI). Population figures come from the U.S. Census Bureau Population Estimates Program (2020-2024 vintage). All datasets are publicly available. Housing data updated 2026-02-28.