Fredericksburg Home Prices: $474K, Up 0.8% — 7 ZIPs Analyzed (2026)
Can you still afford a house in Fredericksburg? At $474,173, the typical home here sits below the half-million mark — but barely. Prices crept up 0.8% over the past year, a pace that won’t make headlines but still matters if you’re budgeting for a down payment.
Quick answer: The average home price in Fredericksburg, VA is $474,173 as of February 2026, up 0.8% year over year according to Zillow.
Current Home Prices in Fredericksburg
Fredericksburg falls within the Washington-Arlington-Alexandria metro area, one of the priciest regions on the East Coast. Yet the city itself stays relatively accessible compared to Northern Virginia suburbs closer to D.C.
| Metric | Value |
|---|---|
| Median Home Value | $474,173 |
| Year-over-Year Change | +0.8% |
| Lowest ZIP Median | $435,525 |
| Highest ZIP Median | $567,925 |
| ZIP Codes Tracked | 7 |
| Data Through | February 2026 |
A 0.8% annual gain means a home worth $474K today was worth roughly $470K a year ago. That’s about $3,800 in appreciation — modest by any standard. Buyers aren’t competing in a runaway market, but sellers aren’t losing ground either.
The spread between the cheapest and most expensive ZIP codes is $132,400. That gap matters. Where you buy within the Fredericksburg area can swing your purchase price by nearly 30%.
For a buyer putting 20% down on the median-priced home, you’re looking at roughly $94,800 upfront. Monthly mortgage payments at a 6.5% rate would land around $2,400 for principal and interest alone — before property taxes, insurance, and maintenance.
Fredericksburg Home Prices by Neighborhood
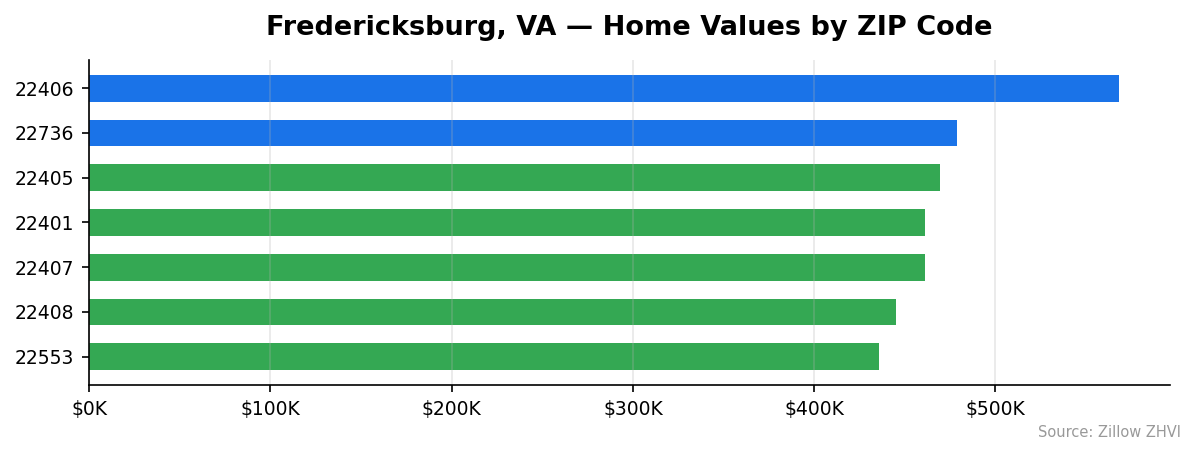
Not all parts of Fredericksburg carry the same price tag. Here’s how the seven tracked ZIP codes compare.
| ZIP Code | Median Home Value | Typical Rent |
|---|---|---|
| 22406 | $567,925 | $1,923/mo |
| 22736 | $478,732 | N/A |
| 22405 | $469,219 | $2,388/mo |
| 22401 | $461,281 | $1,927/mo |
| 22407 | $461,158 | $2,028/mo |
| 22408 | $445,374 | $1,907/mo |
| 22553 | $435,525 | $1,798/mo |
Most Expensive ZIPs
22406 — $567,925. Nearly $94K above the city average, this is Fredericksburg’s priciest ZIP code, yet it carries one of the lower rents at $1,923 per month — a sign of a homeowner-heavy area.
22736 — $478,732. About $4,500 above the city median with no rent data available, suggesting a smaller or more rural market within the metro.
22405 — $469,219. Close to the city average in home values but carries the highest rent in the area at $2,388 per month, pointing to strong rental demand.
Most Affordable ZIPs
22553 — $435,525. The cheapest entry point in Fredericksburg, roughly $39K below the city median, with the lowest rents at $1,798 per month.
22408 — $445,374. About $29K below the city average and rents stay under $1,910 — a solid option for buyers who want lower carrying costs.
22407 — $461,158. Just below the city median at $461K, but rents here run $2,028, higher than several more expensive ZIP codes.
Rent vs Buy in Fredericksburg
Renting is cheaper on paper. Here’s the math.
The median home at $474,173 with 20% down ($94,835) and a 6.5% 30-year fixed rate produces a monthly payment of roughly $2,400 for principal and interest. Add property taxes and insurance, and you’re likely paying $2,700 to $3,000 per month.
| ZIP Code | Typical Rent | Est. Mortgage (P&I) |
|---|---|---|
| 22553 | $1,798/mo | ~$2,200/mo |
| 22408 | $1,907/mo | ~$2,250/mo |
| 22406 | $1,923/mo | ~$2,870/mo |
| 22401 | $1,927/mo | ~$2,330/mo |
| 22407 | $2,028/mo | ~$2,330/mo |
| 22405 | $2,388/mo | ~$2,380/mo |
In most ZIP codes, renting saves you $300 to $900 per month compared to buying. ZIP 22405 is the closest to breakeven — rents there nearly match a mortgage payment on the median home in that area.
The rent-to-buy gap is widest in 22406, where homes cost $568K but rents are only $1,923. Buying there costs roughly $950 more per month than renting before you factor in equity.
Of course, renters build no equity. At 0.8% annual appreciation, a $474K home gains about $3,800 per year. That’s a modest return, but it compounds over time.
Population Growth and Migration
Fredericksburg added nearly 2,000 residents between 2020 and 2024. The city’s population hit 29,992 — a 7.1% increase in four years.
| Year | Population |
|---|---|
| 2020 | 27,995 |
| 2021 | 28,445 |
| 2022 | 28,709 |
| 2023 | 29,226 |
| 2024 | 29,992 |
Growth accelerated in 2023 and 2024. The city added 517 people in 2023 and 766 in 2024 — the largest single-year gain in the period.
How does that stack up against other Virginia cities?
| City | 2024 Population | 4-Year Growth |
|---|---|---|
| Suffolk | 103,105 | +8.8% |
| Fredericksburg | 29,992 | +7.1% |
| Richmond | 233,655 | +3.0% |
| Chesapeake | 254,997 | +2.1% |
| Hampton | 137,596 | +0.2% |
| Alexandria | 159,102 | -0.0% |
Fredericksburg is the second-fastest growing city on this list, behind only Suffolk. Alexandria is essentially flat. Hampton barely moved.
A 7.1% population jump in a small city means more competition for housing. With fewer than 30,000 residents, even a few hundred new arrivals per year can tighten inventory and support prices. That steady inflow helps explain why values haven’t dropped despite the modest 0.8% appreciation rate — demand is there, just not enough to push prices sharply higher.
Fredericksburg Housing Market Trends
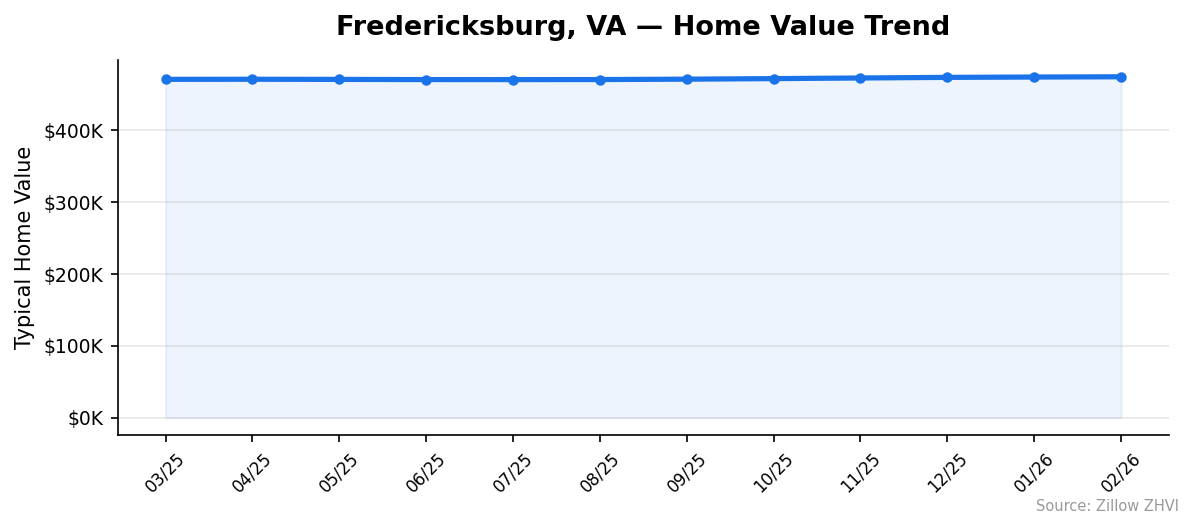
Here’s how the median home value moved month by month over the past year.
| Month | Median Value | Low ZIP | High ZIP |
|---|---|---|---|
| Feb 2026 | $474,173 | $435,525 | $567,925 |
| Jan 2026 | $473,824 | $432,911 | $568,155 |
| Dec 2025 | $473,359 | $431,850 | $567,434 |
| Nov 2025 | $472,502 | $431,920 | $565,585 |
| Oct 2025 | $471,627 | $432,360 | $563,773 |
| Sep 2025 | $470,867 | $432,758 | $562,965 |
| Aug 2025 | $470,321 | $433,319 | $563,185 |
| Jul 2025 | $470,249 | $435,359 | $563,898 |
| Jun 2025 | $470,289 | $438,252 | $564,514 |
| May 2025 | $470,547 | $441,369 | $564,715 |
| Apr 2025 | $470,748 | $442,027 | $564,727 |
| Mar 2025 | $470,617 | $441,799 | $564,239 |
Two patterns stand out. First, the city-wide median bottomed near $470K in mid-2025 and has climbed every month since September. The gain is small — about $3,300 over five months — but the direction is consistent.
Second, the cheapest ZIP code got cheaper. It dropped from $442K in April 2025 to $435K in February 2026, a decline of about $6,500. Meanwhile, the most expensive ZIP rose from $564K to $568K. The gap between the top and bottom is widening.
Is Fredericksburg a Good Place to Buy in 2026?
The numbers paint a balanced picture. Prices aren’t falling, but they’re barely rising. At 0.8% annual appreciation, you’re not going to build quick equity — but you’re also not buying into a declining market.
Fredericksburg’s position along the I-95 corridor between Richmond and D.C. keeps demand steady. The 7.1% population growth rate confirms people are moving in, not out. That demographic support gives the market a floor.
For buyers: you have negotiating room. A market moving at 0.8% per year isn’t one where sellers hold all the power. There’s no urgency to bid over asking price.
For investors: rental yields vary widely by ZIP code. The gap between rent and mortgage payments means cash-flow-positive rentals are hard to find at current prices without a large down payment.
If you’re buying to live in for five or more years, the slow-and-steady appreciation trend works in your favor. If you’re looking for quick gains, the data doesn’t support that expectation.
Fredericksburg Housing Market Outlook for 2026-2027
The 12-month trend shows a clear pattern: flat through mid-2025, then a slow climb starting in the fall. Since September 2025, the median has risen about $660 per month on average.
If that pace continues through 2026, the median could reach the $478K to $482K range by year-end. That would represent roughly 1.5% to 2% total appreciation for the year — an acceleration from the 0.8% annual rate recorded in February.
The three-month trend from December 2025 to February 2026 confirms the upward direction. Each month posted a gain, and the monthly increases have been consistent at $350 to $800.
There’s no sign of a pullback in the data. But there’s also nothing to suggest a breakout. Expect steady, single-digit percentage gains through 2027 unless mortgage rates shift dramatically or the D.C. metro economy changes course.
Similar Markets in VA
If you’re comparing options across Virginia, here are a few other markets worth reviewing.
- Fredericksburg buyers on a tighter budget might look at Hampton, which sits in the Hampton Roads region with slower growth.
- Those willing to go further from D.C. could consider Chesapeake or Suffolk, both in southeast Virginia.
- Buyers who want to stay along the I-95 corridor should compare Woodbridge and Manassas, closer to D.C. but often at higher price points.
- For Northern Virginia alternatives, check Fairfax or Arlington.
Frequently Asked Questions
What is the average home price in Fredericksburg?
The average home price in Fredericksburg, VA is $474,173 as of February 2026. Across the seven tracked ZIP codes, values range from $435,525 in ZIP 22553 to $567,925 in ZIP 22406. The city-wide median sits just below the $475K mark.
Are home prices going up or down in Fredericksburg?
Prices are going up, slowly. The year-over-year increase is 0.8%, which translates to about $3,800 in value gain. Since September 2025, the median has risen every month, so the trend is steady upward — not stagnant.
Is it cheaper to rent or buy in Fredericksburg?
Renting is cheaper in most ZIP codes. Typical rents range from $1,798 to $2,388 per month. A mortgage on the median-priced home at 6.5% would run about $2,400 per month for principal and interest alone. After taxes and insurance, buying costs $700 to $1,000 more per month than renting in most neighborhoods.
What is the most affordable neighborhood in Fredericksburg?
ZIP code 22553 has the lowest median home value at $435,525 and the lowest rent at $1,798 per month. It’s roughly $39,000 below the city-wide median, making it the most budget-friendly option in the Fredericksburg area.
Methodology
Home values are based on the Zillow Home Value Index (ZHVI), a smoothed measure of typical home values in the 35th to 65th percentile range. Rent estimates use the Zillow Observed Rent Index (ZORI). Population figures come from the U.S. Census Bureau Population Estimates Program (2020-2024 vintage). All datasets are publicly available. Housing data updated 2026-02-28.