Lexington Home Prices: $374K, Up 4.2% — 14 ZIPs Analyzed (2026)
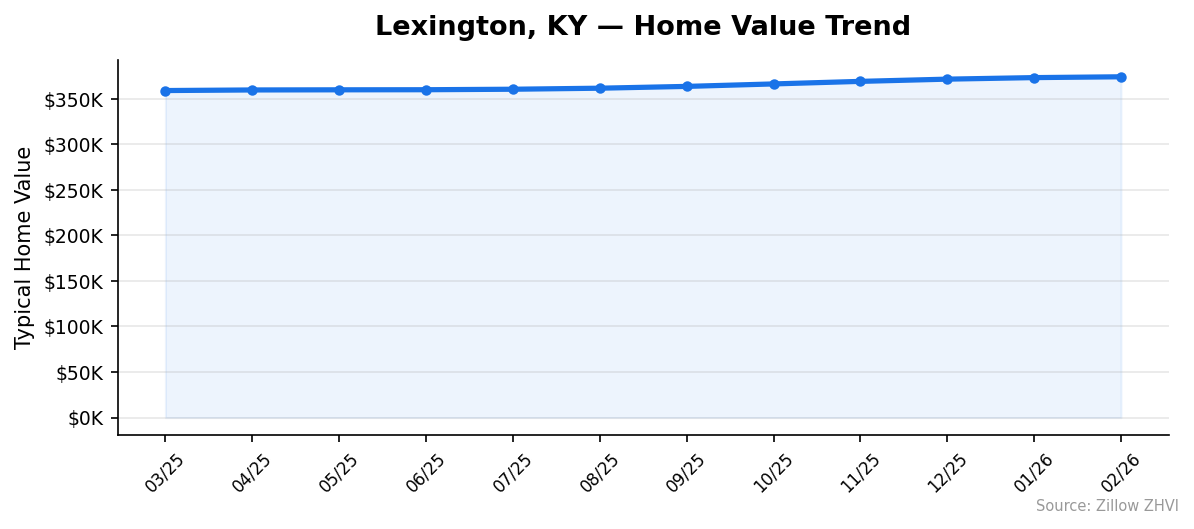
Prices have climbed for 12 straight months in Lexington. The typical home hit $374,163 in February 2026 — up 4.2% from a year earlier. Values range from $217,430 in the cheapest ZIP to $720,865 in the most expensive, a 3.3x spread within the same city.
Quick answer: The average home price in Lexington, KY is $374,163 as of February 2026, up 4.2% year over year according to Zillow.
Current Home Prices in Lexington
$374,163. That’s the midpoint of typical home values across the 14 ZIP codes inside Lexington-Fayette. A year ago the number was $359,061. The climb works out to about $15,100 in added equity for owners who held through the last 12 months.
| Metric | Value |
|---|---|
| Median home value | $374,163 |
| Year-over-year change | +4.2% |
| Cheapest ZIP | $217,430 (40508) |
| Most expensive ZIP | $720,865 (40510) |
| ZIP codes tracked | 14 |
| Data through | February 2026 |
The gap between the bottom and top of the market is wide. A buyer priced out of the $535K median in 40502 can still find homes at less than half that price in 40508 or 40505. Both sit inside the city limits.
Lexington is not cheap by Kentucky standards. The median sits roughly $85K above Bowling Green and well above most smaller Kentucky markets. It is, however, below the national median — so you are paying more than most Kentuckians but less than the typical American homebuyer.
Monthly values have moved up without a single decline in the past year. That kind of straight-line appreciation is unusual. Most markets see at least one down month per year from seasonal drift alone.
Lexington Home Prices by Neighborhood
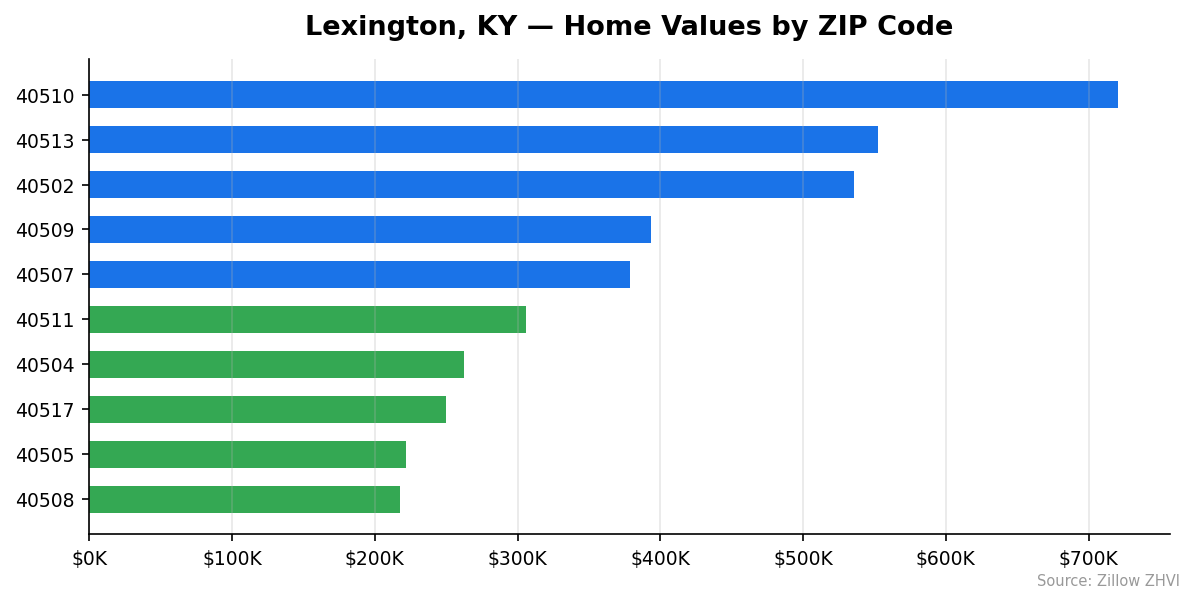
Fourteen ZIPs, three distinct price tiers. The luxury tier sits above $500K. The mid-tier clusters from $300K to $400K. The affordable tier lands under $270K.
| ZIP | Median Value | Median Rent |
|---|---|---|
| 40510 | $720,865 | — |
| 40513 | $552,731 | — |
| 40502 | $535,892 | $1,371 |
| 40509 | $393,346 | $1,598 |
| 40507 | $378,590 | $1,697 |
| 40515 | $372,861 | $1,530 |
| 40514 | $362,967 | $1,913 |
| 40503 | $334,308 | $1,653 |
| 40516 | $329,175 | — |
| 40511 | $306,196 | $1,853 |
| 40504 | $262,424 | $1,220 |
| 40517 | $249,620 | $1,338 |
| 40505 | $221,876 | $1,377 |
| 40508 | $217,430 | $1,152 |
Most Expensive
- 40510 — $720,865. The single priciest ZIP in the city, running almost double the city median. No rent data is reported for this area, which is typical of low-inventory outer ZIPs.
- 40513 — $552,731. The second luxury ZIP, roughly $168K above the metro average.
- 40502 — $535,892. The most expensive ZIP with rent data. Rents run $1,371 — surprisingly moderate for a neighborhood with half-million-dollar homes.
Most Affordable
- 40508 — $217,430. The cheapest ZIP in Lexington and the cheapest rent at $1,152. Sits 42% below the city median.
- 40505 — $221,876. Second-cheapest by value but rents at $1,377, higher than 40508 relative to price.
- 40517 — $249,620. Rents at $1,338. Buying here means paying about one-third less than the citywide median.
Rent vs Buy in Lexington
Across the 11 ZIPs reporting rent data, the typical monthly rent is about $1,518. Mortgage math on a $374,163 home with 20% down ($74,833) works out differently.
| Monthly Cost | Renting | Buying (median home) |
|---|---|---|
| Principal & interest (30-yr, 7%) | — | ~$1,992 |
| Property tax (~0.85%) | — | ~$265 |
| Insurance | — | ~$100 |
| Rent | $1,518 | — |
| Total monthly | $1,518 | ~$2,357 |
Renting saves roughly $840 a month in cash outflow. But a share of the mortgage payment builds equity, and 4.2% appreciation adds meaningfully to an owner’s net worth over time.
The rental discount is largest in the luxury ZIPs. In 40502, a $535K home rents for just $1,371 — making the rent-to-price ratio unusually favorable for renters. In cheaper areas like 40511, rents run $1,853 against a $306K home value, narrowing the gap.
If you plan to stay less than five years, renting looks like the better math in Lexington today. Stay longer, and appreciation plus principal paydown starts to tilt the other way.
Lexington Housing Market Trends
Twelve months. Twelve increases. Lexington has not had a down month since at least March 2025.
| Month | Median Value | Change |
|---|---|---|
| Feb 2026 | $374,163 | +$897 |
| Jan 2026 | $373,266 | +$1,692 |
| Dec 2025 | $371,574 | +$2,447 |
| Nov 2025 | $369,127 | +$2,806 |
| Oct 2025 | $366,321 | +$2,712 |
| Sep 2025 | $363,609 | +$1,977 |
| Aug 2025 | $361,632 | +$1,135 |
| Jul 2025 | $360,497 | +$538 |
| Jun 2025 | $359,959 | +$99 |
| May 2025 | $359,860 | +$154 |
| Apr 2025 | $359,706 | +$645 |
| Mar 2025 | $359,061 | — |
The pace tells its own story. Gains were flat to tiny in spring 2025 — under $200 a month for May and June. Then fall 2025 brought the hottest stretch, with October adding nearly $2,800 in a single month. Early 2026 has cooled somewhat, with February’s $897 gain the smallest since last summer.
The min and max ZIP values both climbed, but not at the same rate. The top ZIP (40510) gained $59,802 over 12 months — about 9.1% appreciation, more than double the citywide rate. The bottom (40508) added just $4,749, a 2.2% gain. The luxury end of Lexington is outpacing the entry level.
Is Lexington a Good Place to Buy in 2026?
Twelve consecutive months of gains point to a seller’s market. Inventory must be tight — otherwise prices would have flattened or dipped somewhere along the way.
For buyers, the math looks less friendly than last spring. You are paying $15,100 more for the same home, and mortgage rates near 7% mean every dollar of price costs you about seven dollars in interest over 30 years.
The wide ZIP spread is the opening. If you can be flexible on neighborhood, 40508, 40505, and 40517 all trade at $100K+ below the city median. That puts a Lexington home in the reach of buyers who would be priced out of Nashville, Charlotte, or even Louisville.
For sellers, the data is favorable. Every month you waited in 2025, your home got more valuable. That pattern has not broken yet.
Lexington Housing Market Outlook for 2026-2027
The 3-month trend suggests decelerating growth. Monthly gains have shrunk from nearly $2,800 in October to under $900 in February. If that cooling continues, year-over-year appreciation could drop from the current 4.2% toward something closer to 2-3% by mid-2026.
That said, prices are still rising — just more slowly. Nothing in the data points to a decline. The minimum ZIP value, median, and maximum all moved up in the most recent month.
If the current pace continues, Lexington’s median should clear $380K sometime in late spring 2026. A sharper reacceleration would put $390K in play before year-end. A harder deceleration could leave prices flat through summer.
Similar Markets in KY
- Louisville — Kentucky’s largest metro and the natural comparison point for anyone choosing between the state’s two biggest cities.
- Bowling Green — a smaller, typically more affordable Kentucky market for buyers priced out of Lexington.
- Pineville — a small-town Kentucky alternative with a very different price profile from Lexington’s metro.
- Whitesburg — Eastern Kentucky option for buyers prioritizing affordability over urban amenities.
Frequently Asked Questions
What is the average home price in Lexington?
The typical Lexington home is worth $374,163 as of February 2026. That figure represents the middle of the market across 14 ZIP codes inside Lexington-Fayette. Values range from $217,430 in the cheapest ZIP to $720,865 in the priciest.
Are home prices going up or down in Lexington?
Up. Prices rose 4.2% over the last year and have increased every single month for the past 12 months. February 2026 marks a new peak for the city.
Is it cheaper to rent or buy in Lexington?
Renting is cheaper month to month — about $1,518 in typical rent versus roughly $2,357 in mortgage, tax, and insurance on a median-priced home with 20% down. The gap narrows once you factor in equity buildup and 4.2% annual appreciation.
What is the most affordable neighborhood in Lexington?
ZIP 40508 at $217,430 is the cheapest. It is also the cheapest rental market at $1,152. ZIP 40505 ($221,876) and 40517 ($249,620) round out the three most affordable areas.
Methodology
Home values are based on the Zillow Home Value Index (ZHVI), a smoothed measure of typical home values in the 35th to 65th percentile range. Rent estimates use the Zillow Observed Rent Index (ZORI). Population figures come from the U.S. Census Bureau Population Estimates Program (2020-2024 vintage). All datasets are publicly available. Housing data updated 2026-02-28.