Little Rock Home Prices: $261K, Up 1.5% — 13 ZIPs Analyzed (2026)
$260,653. That’s the typical home value in Little Rock as of February 2026, up 1.5% from a year earlier. Prices have risen every month since last summer, and the gap between the cheapest and most expensive ZIPs is now more than $359,000.
Quick answer: The average home price in Little Rock, AR is $260,653 as of February 2026, up 1.5% year over year according to Zillow.
Current Home Prices in Little Rock
The Little Rock housing market is moving up, but slowly. The current median sits at $260,653, a modest gain over the prior year. That’s well below the national typical home value and a fraction of what buyers pay in coastal metros.
| Metric | Value |
|---|---|
| Median home value | $260,653 |
| Year-over-year change | +1.5% |
| Lowest ZIP value | $110,270 |
| Highest ZIP value | $469,758 |
| ZIP codes analyzed | 13 |
| Data through | February 2026 |
The price spread tells you a lot. The most expensive ZIP costs roughly 4.3 times the cheapest one. That’s a wide range for a city this size, and it reflects the split between west Little Rock’s newer subdivisions and the older neighborhoods south and east of downtown.
A 1.5% annual gain is below the long-run rate of inflation. For sellers, that means flat real returns. For buyers, it means the market is steady — neither overheated nor crashing. If you bought in February 2025 at the metro median, your home is worth about $3,855 more on paper today.
The metro area covered here — Little Rock-North Little Rock-Conway — extends beyond the city boundary, but this analysis focuses on the 13 ZIP codes inside Little Rock proper.
Little Rock Home Prices by Neighborhood
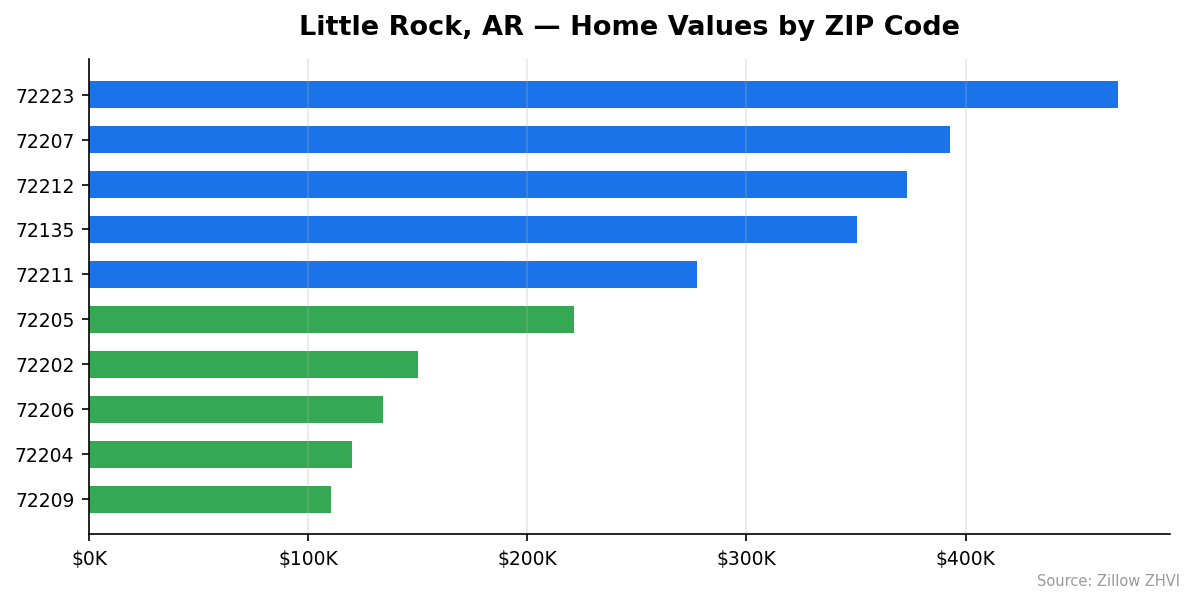
Where you buy in Little Rock matters more than when. The cheapest ZIP and the most expensive ZIP are separated by less than 15 miles, but the price gap is roughly $359,000.
| ZIP Code | Typical Home Value | Avg Monthly Rent |
|---|---|---|
| 72223 | $469,758 | $1,275 |
| 72207 | $392,768 | $1,613 |
| 72212 | $373,234 | $1,823 |
| 72135 | $350,339 | — |
| 72211 | $277,212 | $1,081 |
| 72227 | $267,228 | $1,097 |
| 72210 | $267,180 | — |
| 72201 | $255,022 | — |
| 72205 | $221,095 | $1,226 |
| 72202 | $150,167 | $1,112 |
| 72206 | $134,080 | $1,001 |
| 72204 | $120,140 | $1,128 |
| 72209 | $110,270 | $1,106 |
Most Expensive
72223 leads the city at $469,758, roughly 80% above the citywide median. Despite the home prices, average rents in 72223 sit at $1,275 — a ratio that favors renters.
72207 comes in at $392,768, with the second-highest rents in the city at $1,613.
72212 runs $373,234 and posts the highest rents anywhere in Little Rock at $1,823.
Most Affordable
72209 is the cheapest ZIP at $110,270, less than half the city median. Rents here average $1,106.
72204 sits at $120,140 with rents around $1,128 — meaning monthly rent is more than 1% of home value, an unusually high ratio.
72206 rounds out the bottom three at $134,080, with the city’s lowest rents at $1,001.
Rent vs Buy in Little Rock
Rent data is available for 10 of 13 Little Rock ZIPs. The average across those areas is roughly $1,246 per month.
A 30-year mortgage at 7% on a $260,653 home with 20% down works out to about $1,387 in principal and interest. Add property tax (roughly $200/month at Arkansas rates) and insurance (around $130), and the monthly carrying cost lands near $1,717.
| Cost Type | Monthly |
|---|---|
| Average rent (10 ZIPs) | ~$1,246 |
| Mortgage P&I (20% down, 7%) | ~$1,387 |
| Tax + insurance estimate | ~$330 |
| Total ownership cost | ~$1,717 |
Renting is cheaper on a monthly basis by roughly $470. That gap widens in cheaper ZIPs like 72209 and 72204, where home prices are low but rents are nearly identical to the citywide average. It narrows — or flips — in west Little Rock, where 72212 rents of $1,822 nearly match the cost of buying there.
You’re paying for optionality when you rent. You’re paying for equity when you buy. With prices growing only 1.5% annually, that equity is building slowly.
Population Growth and Migration
Little Rock added 2,167 residents between 2020 and 2024 — a 1.1% gain over four years. That’s modest, especially compared to its in-state peers.
| Year | Population |
|---|---|
| 2020 | 202,607 |
| 2021 | 202,141 |
| 2022 | 203,416 |
| 2023 | 204,235 |
| 2024 | 204,774 |
The city dipped slightly in 2021 before resuming steady growth. By 2024, the population had recovered and exceeded its 2020 baseline.
Look at how Little Rock stacks up against other Arkansas cities:
| City | 2024 Population | 4-Year Growth |
|---|---|---|
| Little Rock | 204,774 | +1.1% |
| Fayetteville | 103,134 | +8.8% |
| Jonesboro | 82,384 | +4.5% |
| Rogers | 75,639 | +7.5% |
| Conway | 70,711 | +9.9% |
| Bentonville | 61,791 | +12.7% |
Northwest Arkansas is where the growth is. Bentonville grew 11x faster than Little Rock. Conway, which is part of the same metro, grew nearly 10x faster.
For Little Rock housing, slow population growth points to slow demand growth. That helps explain the 1.5% price gain — not a flood of new buyers, just steady local demand against a steady supply.
Little Rock Housing Market Trends
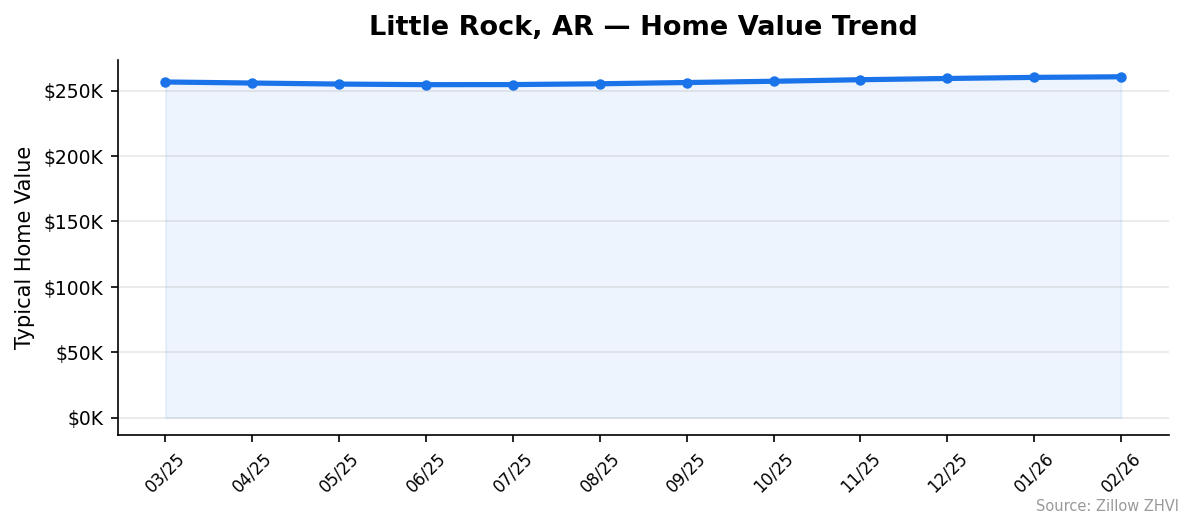
Prices in Little Rock have climbed for nine straight months. The bottom hit in June 2025 at $254,627, and values have risen every month since.
| Month | Median Value |
|---|---|
| Feb 2026 | $260,653 |
| Jan 2026 | $260,193 |
| Dec 2025 | $259,362 |
| Nov 2025 | $258,413 |
| Oct 2025 | $257,232 |
| Sep 2025 | $256,269 |
| Aug 2025 | $255,308 |
| Jul 2025 | $254,708 |
| Jun 2025 | $254,627 |
| May 2025 | $255,090 |
| Apr 2025 | $255,878 |
| Mar 2025 | $256,675 |
There’s a clear pattern. Prices fell from March 2025 ($256,675) through June 2025 ($254,627), then started a slow climb. The total move over twelve months was less than $4,000, or about 1.5%.
The most recent three months show acceleration. Between November 2025 and February 2026, the median rose by $2,240 — roughly 0.86% in a quarter. If that pace continued for a full year, annual growth would be closer to 3.5%.
That’s still well below the post-2020 highs seen in many markets, but it suggests Little Rock has shifted from flat to slowly rising.
Is Little Rock a Good Place to Buy in 2026?
For owner-occupants, yes — with caveats. Prices are appreciating, but at a rate that’s below typical mortgage interest costs. You won’t make money quickly on equity alone.
The price-to-rent ratio is the better story. With a citywide median of $260,653 and average rents around $1,246, the ratio is about 17.4. That’s neutral — not a screaming buy, not a clear sell.
Affordable ZIPs like 72209, 72204, and 72206 are below $135,000 and have rent ratios that favor landlords. These are the areas where investors will see the best cash-flow numbers.
For buyers chasing west Little Rock, expect to pay $370,000-$470,000 for the most desirable ZIPs. Rents there don’t fully cover ownership costs, so these neighborhoods favor end-users over investors.
The market right now leans slightly toward sellers. Prices are rising, inventory pressures aren’t building, and population is stable. But it’s not a frenzy.
Little Rock Housing Market Outlook for 2026-2027
The 3-month trend in Little Rock is clearly upward. Median values rose by $2,240 from November 2025 to February 2026 — an annualized rate of roughly 3.5%, more than double the trailing-twelve-month figure.
If the current pace continues, you’d expect prices to keep grinding higher through 2026. The momentum visible in the monthly trend points to continued modest gains over the next three to six months, not a sharp move in either direction.
Year-over-year, growth has been 1.5%. The recent acceleration suggests next year’s number could come in higher if the pattern holds — but this is a slow market by nature, and population growth of 1.1% over four years isn’t going to drive a boom.
Watch the cheapest ZIPs. They’ve been the strongest performers in percentage terms, and that pattern often persists in markets where affordability is the main draw.
Similar Markets in AR
If you’re looking elsewhere in Arkansas, three cities are worth comparing:
- Fayetteville — Northwest Arkansas’s growth story, with population up 8.8% over four years and a different price profile than Little Rock.
- Fort Smith — A smaller market on the Oklahoma border, often cheaper than Little Rock for similar-sized homes.
- North Little Rock — Right across the river, with overlapping commute patterns and typically lower prices than Little Rock proper.
Buyers priced out of west Little Rock should check North Little Rock first.
Frequently Asked Questions
What is the average home price in Little Rock?
The average home price in Little Rock, AR is $260,653 as of February 2026. That figure is the typical home value across 13 ZIP codes in the city. It’s up 1.5% from a year earlier.
Are home prices going up or down in Little Rock?
Prices are going up. The year-over-year change is +1.5%, and values have risen every month since June 2025, when the local low of $254,627 was set. The 3-month pace has been faster than the 12-month average.
Is it cheaper to rent or buy in Little Rock?
Renting is cheaper monthly. Average rents across 10 ZIPs run about $1,246, while a mortgage with taxes and insurance on a median-priced home runs closer to $1,717. The gap shrinks in west Little Rock, where rents are highest.
What is the most affordable neighborhood in Little Rock?
ZIP 72209 in southwest Little Rock is the cheapest at $110,270 — less than half the city median. ZIP 72204 follows at $120,140, and 72206 at $134,080. All three sit well below the citywide average.
Methodology
Home values are based on the Zillow Home Value Index (ZHVI), a smoothed measure of typical home values in the 35th to 65th percentile range. Rent estimates use the Zillow Observed Rent Index (ZORI). Population figures come from the U.S. Census Bureau Population Estimates Program (2020-2024 vintage). All datasets are publicly available. Housing data updated 2026-02-28.