Longmont Home Prices: $597K, Down 2.7% — 3 ZIPs Analyzed (2026)
$597,332. That’s what a typical home costs in Longmont right now — and it’s heading in the wrong direction if you’re a seller. Prices fell 2.7% over the past year, continuing a steady slide that started in spring 2025. For buyers who’ve been waiting on the sidelines, the math is finally starting to shift.
Quick answer: The average home price in Longmont, CO is $597,332 as of February 2026, down 2.7% year over year according to Zillow.
Current Home Prices in Longmont
| Metric | Value |
|---|---|
| Median Home Price | $597,332 |
| Year-over-Year Change | -2.7% |
| Lowest ZIP Median | $484,245 |
| Highest ZIP Median | $731,433 |
| Number of ZIPs Tracked | 3 |
| Data As Of | February 2026 |
The gap between the cheapest and most expensive ZIP codes in Longmont is nearly $250,000. That spread tells you this isn’t a one-size-fits-all market. Where you buy matters almost as much as when.
A year ago, the city-wide median sat closer to $614,000. The drop of roughly $17,000 isn’t dramatic in dollar terms, but 2.7% is enough to catch the attention of anyone tracking Front Range pricing. This isn’t a crash. It’s a correction — slow, steady, and consistent month over month.
Longmont falls within the Greeley metro area for statistical purposes. Compared to Denver proper and Boulder, it has historically offered a discount. That gap is widening slightly as Longmont prices soften while some neighboring markets hold firmer.
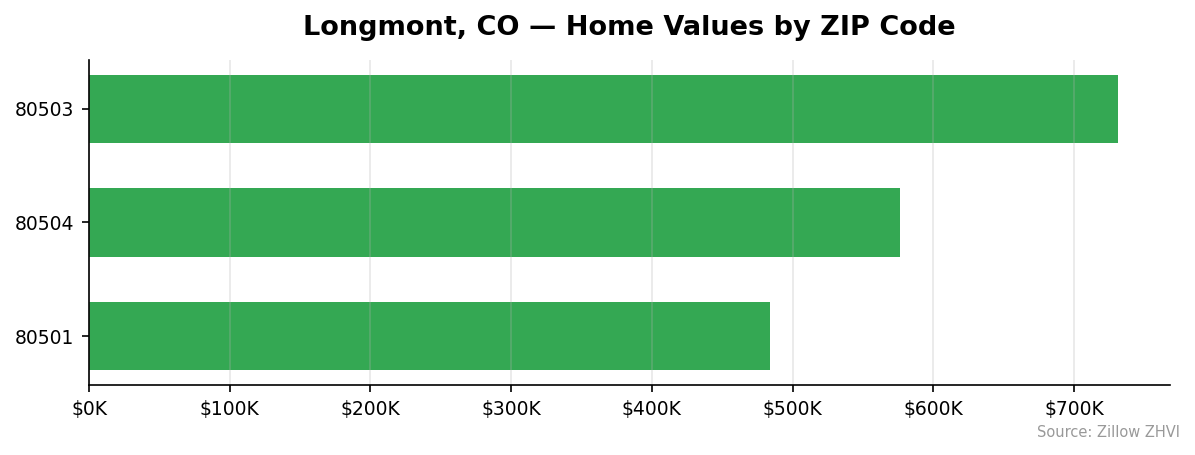
Longmont Home Prices by Neighborhood
| ZIP Code | Median Home Value | Median Rent |
|---|---|---|
| 80503 | $731,433 | $1,816/mo |
| 80504 | $576,319 | $2,030/mo |
| 80501 | $484,245 | $1,739/mo |
Most Expensive
80503 leads at $731,433 — nearly $134,000 above the city average. Despite the premium price tag, rent here runs $1,816/month, actually lower than the mid-tier ZIP. That disconnect between home values and rents suggests buyers in 80503 are paying for long-term appreciation potential or lifestyle factors rather than rental income math.
Most Affordable
80501 comes in at $484,245, a full $113,000 below the Longmont average. It also carries the lowest rent at $1,739/month. If you’re looking for the most accessible entry point into the Longmont market, this ZIP is it. You could buy here for roughly 66% of what you’d pay in 80503.
80504 splits the difference at $576,319 but carries the highest rents of any Longmont ZIP at $2,030/month. That combination — moderate purchase price, strong rental demand — makes it worth a closer look for investors.
Rent vs Buy in Longmont
The rent-versus-buy gap in Longmont is wide right now, and it favors renters.
Average rent across all three ZIP codes comes to about $1,861/month. Now run the mortgage math on the $597,332 median. With 20% down ($119,466), you’re financing $477,866. At a 7% rate on a 30-year fixed, that’s roughly $3,179/month in principal and interest alone. Add property taxes and insurance, and you’re looking at somewhere around $3,500–$3,700 per month.
| Scenario | Monthly Cost |
|---|---|
| Average Rent (all ZIPs) | ~$1,861 |
| Mortgage (P&I, 20% down, 7%) | ~$3,179 |
| Estimated Total (taxes + insurance) | ~$3,500–$3,700 |
That’s nearly double. Renting saves you roughly $1,700/month compared to owning, before accounting for maintenance, HOA fees, or the opportunity cost of your down payment.
The standard advice is to buy when you plan to stay 5+ years. In a market that’s declining 2.7% annually, that breakeven timeline stretches further. If prices keep falling at this pace, you’d need appreciation to reverse before the equity math works in your favor.
For now, renting is the cheaper option by a wide margin.
Population Growth and Migration
Longmont’s population reached 99,818 in 2024. The city has grown just 0.6% since 2020 — essentially flat.
| Year | Population |
|---|---|
| 2020 | 99,206 |
| 2021 | 99,741 |
| 2022 | 99,006 |
| 2023 | 99,105 |
| 2024 | 99,818 |
Look at the dip in 2022. The city actually lost residents that year before slowly recovering. That’s unusual for a Colorado municipality during a period when most Front Range cities were still growing.
Compare Longmont to its neighbors:
| City | 2024 Population | 4-Year Growth |
|---|---|---|
| Greeley | 114,363 | 4.6% |
| Aurora | 403,130 | 4.2% |
| Thornton | 146,689 | 3.2% |
| Colorado Springs | 493,554 | 2.5% |
| Denver | 729,019 | 1.6% |
| Longmont | 99,818 | 0.6% |
Longmont’s growth rate is the lowest in this group by a wide margin. Greeley — part of the same metro — grew nearly 8 times faster. That sluggish population growth helps explain the softening home values. Fewer new residents means less demand pressure on housing stock.
Longmont Housing Market Trends
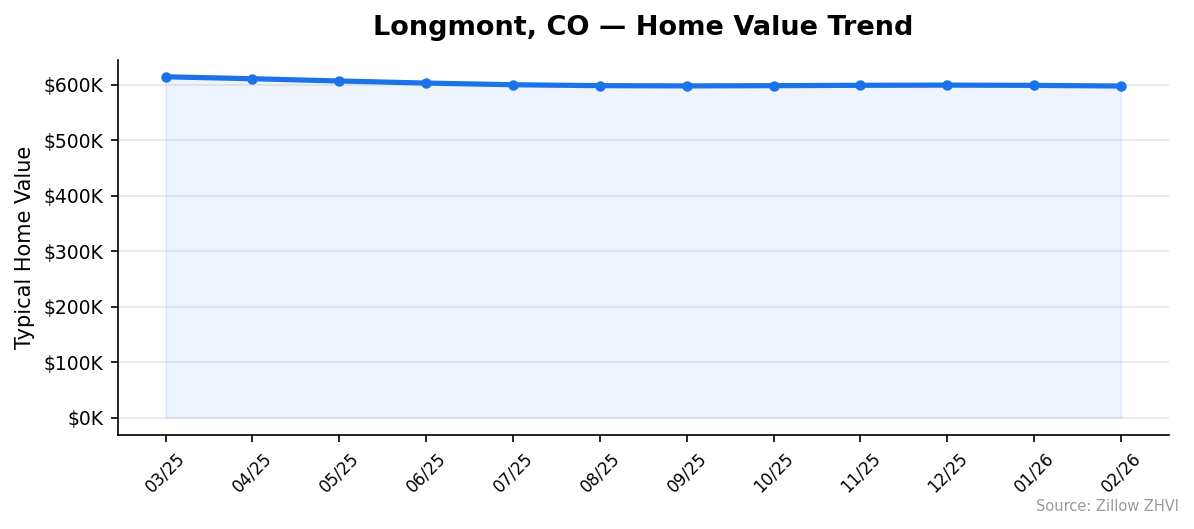
Here’s how the median home price moved month by month over the past year:
| Month | Median Price | Price Range |
|---|---|---|
| Mar 2025 | $613,976 | $498,887 – $748,677 |
| Apr 2025 | $610,474 | $495,454 – $744,720 |
| May 2025 | $606,424 | $491,764 – $739,683 |
| Jun 2025 | $602,646 | $488,604 – $734,675 |
| Jul 2025 | $599,649 | $486,296 – $730,638 |
| Aug 2025 | $597,988 | $485,221 – $728,346 |
| Sep 2025 | $597,594 | $485,159 – $727,897 |
| Oct 2025 | $597,982 | $485,356 – $729,167 |
| Nov 2025 | $598,638 | $485,541 – $731,173 |
| Dec 2025 | $598,983 | $485,643 – $732,606 |
| Jan 2026 | $598,521 | $485,354 – $732,436 |
| Feb 2026 | $597,332 | $484,245 – $731,433 |
The pattern is clear. Prices dropped sharply from March through September 2025 — a decline of about $16,400 in six months. Then they flattened. From September 2025 through February 2026, the median barely moved, hovering in a tight band between $597K and $599K.
That plateau could mean the market is finding a floor. Or it could mean the next leg down hasn’t started yet. What’s certain: the steep spring-to-fall decline has paused.
Is Longmont a Good Place to Buy in 2026?
The data paints a mixed picture.
On the positive side, prices have stabilized after months of decline. If you’re buying to live in for 7–10 years, the current price of $597K may look reasonable in hindsight — especially if you lock in before any potential rate cuts push demand higher.
On the negative side, Longmont’s population growth is nearly stagnant at 0.6% over four years. Nearby cities are growing much faster, which could redirect development dollars and infrastructure investment away from Longmont. The rent-to-buy ratio also works against ownership right now.
This is a buyer’s market. Sellers are watching their equity erode month by month, and the negotiating power has shifted to buyers. If you’re serious about Longmont, you have time. There’s no bidding war pressure pushing you to act fast.
The strongest case for buying is in 80501, where the $484K median puts you well below the city average and monthly costs are more manageable.
Longmont Housing Market Outlook for 2026-2027
The 12-month trend shows two phases: a steady decline from March to September 2025, followed by five months of near-flat pricing. That deceleration matters.
If the current pace continues, expect prices to drift sideways or decline modestly through mid-2026. The data doesn’t support a rebound. Growth would require either a significant drop in mortgage rates, a surge in population, or both — and neither is visible in the current numbers.
The 3-month trend from December 2025 to February 2026 shows a small decline of about $1,650. At that rate, the median could slip below $595K by summer 2026. But the floor seems close.
Sellers should price realistically. Buyers can afford to be patient but shouldn’t expect a dramatic crash.
Similar Markets in CO
If you’re considering Longmont, these Colorado markets are worth comparing:
- Denver — The state’s largest city offers a much bigger inventory, though typically at higher prices than Longmont.
- Fort Collins — Another northern Colorado option with a similar college-town feel and comparable price range.
- Thornton — Closer to Denver with faster population growth (3.2%) than Longmont.
- Aurora — Growing at 4.2% with a much larger housing stock, though farther from the mountains.
- Westminster — Positioned between Denver and Boulder, a natural alternative for Longmont buyers.
Frequently Asked Questions
What is the average home price in Longmont?
The average home price in Longmont is $597,332 as of February 2026. Prices range from $484,245 in ZIP code 80501 to $731,433 in 80503. The city-wide median has declined from its recent peak of roughly $614,000 in March 2025.
Are home prices going up or down in Longmont?
Down. Home values fell 2.7% year over year. The decline was steepest between March and September 2025, dropping about $16,400 in six months. Since then, prices have largely stabilized in the $597K–$599K range.
Is it cheaper to rent or buy in Longmont?
Renting is significantly cheaper. The average rent across Longmont ZIP codes is about $1,861/month. A mortgage on the median-priced home — assuming 20% down and a 7% rate — runs roughly $3,179/month before taxes and insurance. You’d pay nearly twice as much to own.
What is the most affordable neighborhood in Longmont?
ZIP code 80501 is the most affordable at $484,245, about $113,000 below the city average. Rent there is also the lowest at $1,739/month. It offers the easiest entry point for first-time buyers in the Longmont market.
Methodology
Home values are based on the Zillow Home Value Index (ZHVI), a smoothed measure of typical home values in the 35th to 65th percentile range. Rent estimates use the Zillow Observed Rent Index (ZORI). Population figures come from the U.S. Census Bureau Population Estimates Program (2020-2024 vintage). All datasets are publicly available. Housing data updated 2026-02-28.