Thornton Home Prices: $510K, Down 2.7% — 4 ZIPs Analyzed (2026)
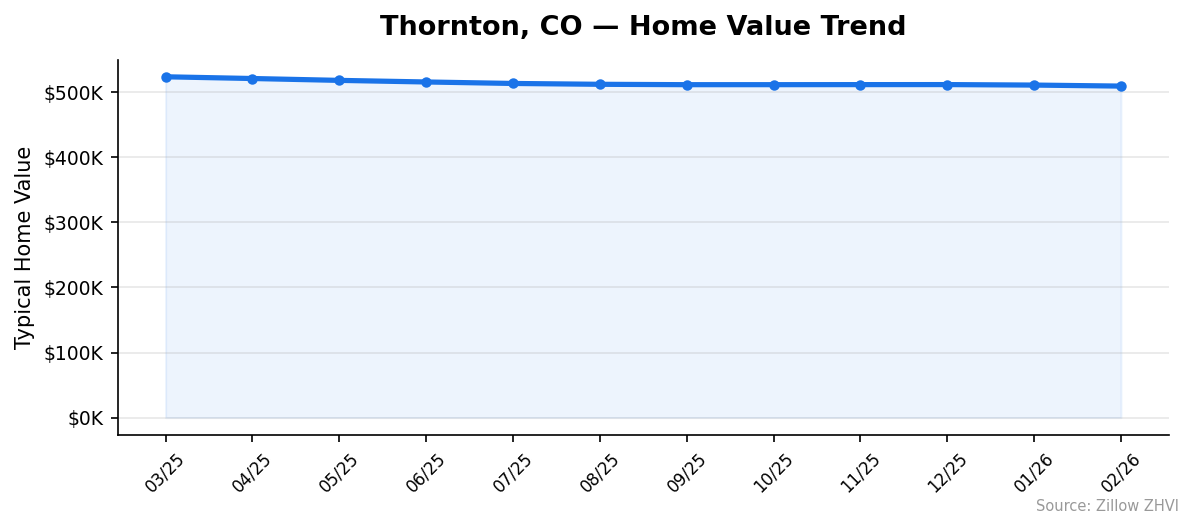
Prices dropped for the 12th straight month in Thornton. The median home now sits at $509,603 — down from nearly $524,000 a year ago. That’s a 2.7% decline, one of the steadier slides in the Denver metro.
If you’re watching the market here, the question isn’t whether prices are falling. They are. The question is how much further they go.
Quick answer: The average home price in Thornton, CO is $509,603 as of February 2026, down 2.7% year over year according to Zillow.
Current Home Prices in Thornton
| Metric | Value |
|---|---|
| Median Home Price | $509,603 |
| Year-over-Year Change | -2.7% |
| Lowest ZIP Median | $420,479 |
| Highest ZIP Median | $643,081 |
| ZIP Codes Tracked | 4 |
| Data as of | February 2026 |
The $510K median puts Thornton below Denver proper but still above the national average. A year ago, the typical home here was worth about $14,000 more.
The price range tells a bigger story. A $222,000 gap separates the cheapest ZIP from the most expensive. That spread means your budget narrows or widens dramatically depending on which part of Thornton you target.
The decline has been gradual — no sharp drops, no panic selling. From March 2025 through February 2026, the median moved from $523,899 to $509,603. That’s roughly $1,200 per month of lost value for the average homeowner.
For buyers, this is the most affordable Thornton has been since mid-2024.
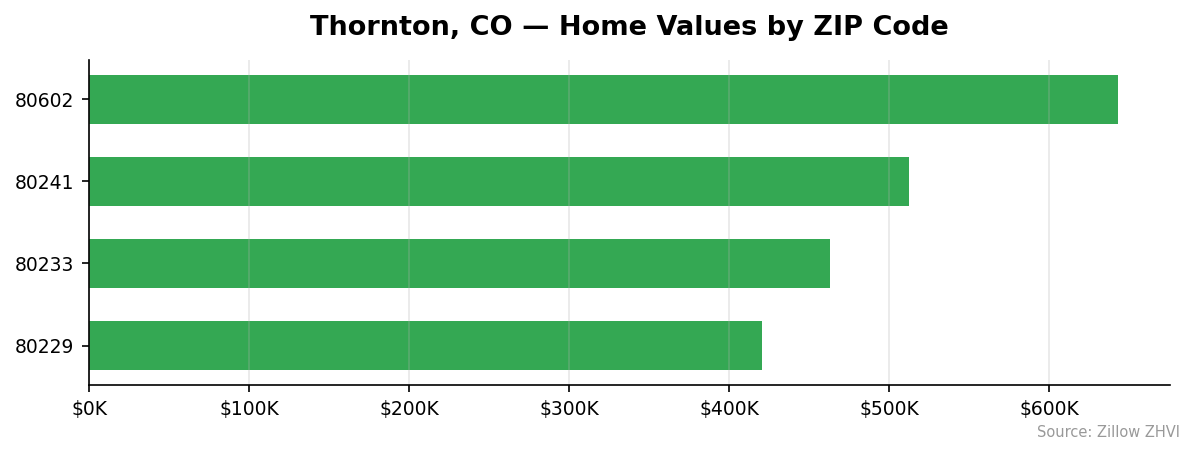
Thornton Home Prices by Neighborhood
| ZIP Code | Median Home Value | Avg Monthly Rent |
|---|---|---|
| 80229 | $420,479 | $1,692 |
| 80233 | $462,853 | $1,762 |
| 80241 | $511,999 | $1,949 |
| 80602 | $643,081 | $2,876 |
Most Expensive
80602 leads Thornton at $643,081 — 26% above the city median. Rents here run $2,876/month, nearly $1,200 more than the cheapest ZIP, reflecting the premium for newer construction in the northeast corridor.
Most Affordable
80229 is the entry point at $420,479, roughly 17% below the city median. At $1,692/month in rent, it’s also the cheapest place to lease in Thornton. 80233 comes in next at $462,853 with rents of $1,762.
The gap between 80602 and 80229 is $222,602. You could put a sizable down payment on a home in 80229 with the difference. If you’re buying in Thornton on a budget, the southern ZIPs are where to look.
Rent vs Buy in Thornton
The average rent across Thornton’s four tracked ZIPs runs about $2,070/month. Here’s what each ZIP looks like:
| ZIP Code | Avg Rent/Month |
|---|---|
| 80229 | $1,692 |
| 80233 | $1,762 |
| 80241 | $1,949 |
| 80602 | $2,876 |
Now compare that to buying. On a $509,603 home with 20% down ($101,921), you’d finance roughly $407,682. At a 7% mortgage rate over 30 years, the principal and interest payment comes to about $2,713/month. Add property taxes and insurance, and you’re looking at $3,200 to $3,400/month in total housing costs.
That’s $1,100+ more per month than renting.
Even in the cheapest ZIP, buying a $420,479 home means a mortgage payment around $2,240/month before taxes — still $548 above the local rent. The math doesn’t favor buyers at current interest rates unless you expect significant appreciation.
Renting makes financial sense in every Thornton ZIP right now. The premium for owning is steep.
Population Growth and Migration
Thornton’s population hit 146,689 in 2024, a gain of 4,498 residents since the 2020 census count of 142,191. That’s 3.2% growth over four years.
| Year | Population |
|---|---|
| 2020 | 142,191 |
| 2021 | 142,942 |
| 2022 | 143,459 |
| 2023 | 145,533 |
| 2024 | 146,689 |
Growth accelerated between 2022 and 2023, when Thornton added over 2,000 residents in a single year. The pace has been steadier since.
How does Thornton compare to its neighbors?
| City | 2024 Population | 4-Year Growth |
|---|---|---|
| Greeley | 114,363 | 4.6% |
| Aurora | 403,130 | 4.2% |
| Thornton | 146,689 | 3.2% |
| Colorado Springs | 493,554 | 2.5% |
| Denver | 729,019 | 1.6% |
| Centennial | 108,853 | 0.6% |
Thornton is growing faster than Denver and Colorado Springs but slower than Greeley and Aurora. Steady population gains put upward pressure on housing demand, which partially explains why prices haven’t collapsed despite 12 months of declines. More people need housing. The correction is moderate, not a freefall.
Thornton Housing Market Trends
| Month | Average Value | Low | High |
|---|---|---|---|
| Mar 2025 | $523,899 | $433,672 | $658,553 |
| Apr 2025 | $521,242 | $431,459 | $655,511 |
| May 2025 | $518,382 | $429,084 | $652,164 |
| Jun 2025 | $515,927 | $427,014 | $649,082 |
| Jul 2025 | $513,645 | $425,068 | $646,237 |
| Aug 2025 | $512,353 | $423,741 | $644,391 |
| Sep 2025 | $511,769 | $422,943 | $643,579 |
| Oct 2025 | $511,781 | $422,526 | $643,839 |
| Nov 2025 | $511,869 | $422,224 | $644,731 |
| Dec 2025 | $511,916 | $422,046 | $645,437 |
| Jan 2026 | $511,156 | $421,556 | $644,765 |
| Feb 2026 | $509,603 | $420,479 | $643,081 |
Two patterns stand out. First, the decline was steepest in spring and early summer 2025 — the market shed about $12,000 from March through August. Second, prices flattened from September through December, barely moving over four months. Then January and February brought renewed softening.
The floor ZIPs and ceiling ZIPs moved in tandem. The cheapest areas dropped from $433,672 to $420,479 (down $13,193) while the priciest fell from $658,553 to $643,081 (down $15,472). The expensive end lost more in dollar terms but less in percentage terms.
Is Thornton a Good Place to Buy in 2026?
The data points to a buyer’s market. Twelve months of price declines give you negotiating room that didn’t exist in 2023 or 2024. Sellers are watching their equity shrink month by month.
But “good time to buy” depends on your math. If you can lock a mortgage under 6.5%, the monthly payment starts to compete with renting. At 7% or above, renting is cheaper in every ZIP code.
Thornton’s 3.2% population growth provides a floor for demand. This isn’t a city people are leaving. The correction looks like a repricing after the pandemic-era run-up, not a market collapse.
If you’re planning to stay five or more years, buying at today’s prices could work out. If you need a short-term hold, the trend is still heading down.
Thornton Housing Market Outlook for 2026-2027
The three-month trend from December 2025 through February 2026 shows prices declining at roughly $1,100 per month. If that pace continues, the median could dip below $500,000 by mid-summer 2026.
But there’s a catch. The September-through-December flat period suggests the market found temporary support around $512,000. The current slide may slow again as spring buying season brings fresh demand.
The most likely scenario: prices continue to drift lower through 2026, but at a decelerating rate. A drop to the $490,000-$505,000 range by year-end would be consistent with the current momentum. A sharp crash looks unlikely given steady population growth and no spike in inventory data.
Watch the spring months closely. If March and April prices stabilize, the bottom may be near.
Similar Markets in CO
If you’re comparing Thornton to other Colorado cities, here are a few worth exploring:
- Aurora — Thornton’s neighbor to the south with faster population growth at 4.2%. A good comparison for suburban Denver pricing.
- Westminster — Immediately adjacent to Thornton and part of the same stretch of the I-25 corridor.
- Denver — The metro anchor. Higher prices but more inventory and a different market dynamic.
- Centennial — South of Denver with slower growth at 0.6%, potentially offering a more stable market.
- Colorado Springs — An hour south but significantly more affordable, growing at 2.5%.
Frequently Asked Questions
What is the average home price in Thornton?
The average home price in Thornton is $509,603 as of February 2026. That number represents the city-wide median across four tracked ZIP codes. Prices within Thornton range from $420,479 in ZIP 80229 to $643,081 in ZIP 80602.
Are home prices going up or down in Thornton?
Prices are going down. Thornton’s median home value fell 2.7% year over year, declining in each of the last 12 tracked months. The sharpest drops came in spring and summer 2025, with the pace slowing in the fall before picking up again in early 2026.
Is it cheaper to rent or buy in Thornton?
Renting is cheaper right now. The average rent across Thornton runs about $2,070/month. A mortgage on the median-priced home at 7% with 20% down costs roughly $2,713/month in principal and interest alone — before taxes and insurance push the total past $3,200.
What is the most affordable neighborhood in Thornton?
ZIP code 80229 is the most affordable area in Thornton at $420,479 median home value. That’s $89,000 below the city-wide median. Rent in 80229 averages $1,692/month, also the lowest in the city.
Methodology
Home values are based on the Zillow Home Value Index (ZHVI), a smoothed measure of typical home values in the 35th to 65th percentile range. Rent estimates use the Zillow Observed Rent Index (ZORI). Population figures come from the U.S. Census Bureau Population Estimates Program (2020-2024 vintage). All datasets are publicly available. Housing data updated 2026-02-28.