North Charleston Home Prices: $307K, Down 2.8% — 4 ZIPs (2026)
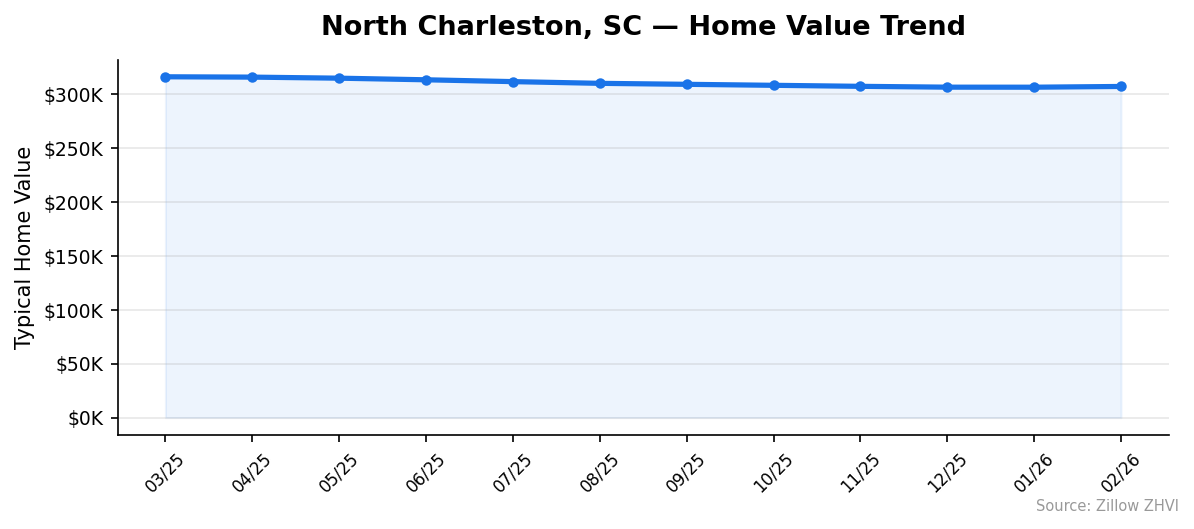
$307,356. That’s what a typical home in North Charleston, SC was worth in February 2026, down 2.8% from a year earlier. Prices have slipped every single month since March 2025, when the typical value sat at $316,333.
Quick answer: The average home price in North Charleston, SC is $307,356 as of February 2026, down 2.8% year over year according to Zillow.
Current Home Prices in North Charleston
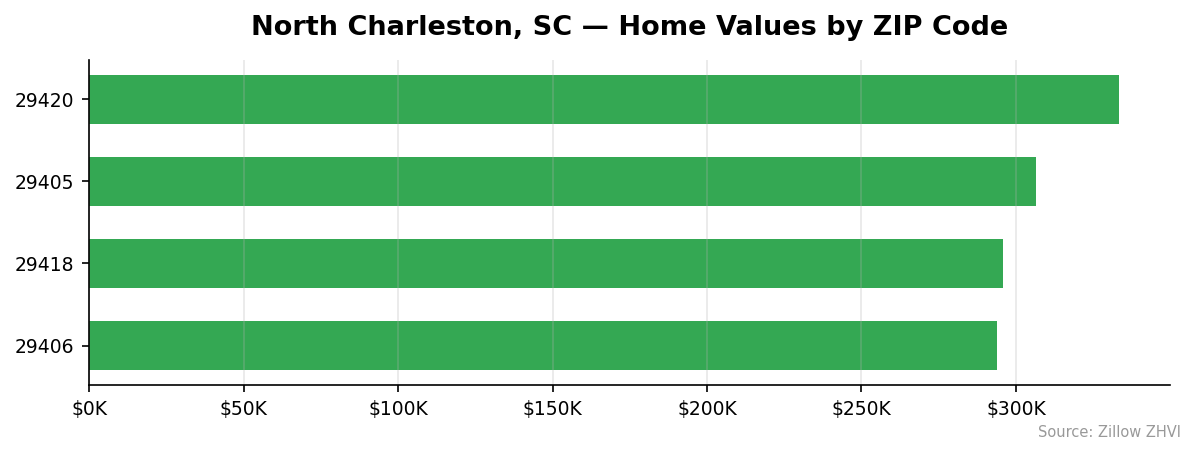
The typical North Charleston home sells for $307,356. That figure covers four ZIP codes inside the city, ranging from $293,899 on the low end to $333,217 on the high end — a $39,318 spread between the cheapest and priciest neighborhoods.
| Metric | Value |
|---|---|
| Median home value (Feb 2026) | $307,356 |
| Year-over-year change | -2.8% |
| Cheapest ZIP | $293,899 |
| Most expensive ZIP | $333,217 |
| Price range | $39,318 |
| ZIPs analyzed | 4 |
| Metro area | Charleston-North Charleston, SC |
A drop of 2.8% means a $307K home today was worth roughly $316K twelve months ago. For a buyer, that’s about $9,000 in savings on the same house. For a seller who bought at the peak, it’s $9,000 of paper losses before closing costs.
The decline isn’t dramatic. But it’s consistent. Over the last twelve months the typical value has moved down in nearly every reading, with no monthly gains larger than $300. That points to a slow-grinding correction rather than a sharp reversal.
The rest of the metro looks similar. Charleston and Mount Pleasant both sit at higher price points, while Goose Creek and Summerville offer cheaper alternatives nearby.
North Charleston Home Prices by Neighborhood
Four ZIP codes make up North Charleston. Here’s how each compares.
| ZIP | Typical Value | Avg Rent (ZORI) | vs. City Avg |
|---|---|---|---|
| 29420 | $333,217 | $1,640 | +8.4% |
| 29405 | $306,380 | $1,887 | -0.3% |
| 29418 | $295,930 | $1,727 | -3.7% |
| 29406 | $293,899 | $1,594 | -4.4% |
Most Expensive
- 29420 — $333,217. The only ZIP above the city average, sitting 8.4% higher than the typical North Charleston home but with rents on the lower end of the range.
- 29405 — $306,380. Almost exactly at the city median for sale prices, but commands the highest rent in the city at $1,887 a month.
- 29418 — $295,930. Below the city median to buy, mid-range to rent.
Most Affordable
- 29406 — $293,899. The cheapest ZIP to buy and to rent, with a typical home priced 4.4% under the city average and rent at $1,594.
- 29418 — $295,930. The second-cheapest entry point, just $2,000 above 29406.
- 29405 — $306,380. Cheaper than the city average to buy, but the priciest place to rent.
Rent vs Buy in North Charleston
Rents in North Charleston run between $1,594 and $1,887 a month across the four ZIPs, averaging roughly $1,712. Buying isn’t cheap by comparison.
A typical $307,356 home with 20% down ($61,471) leaves a $245,885 mortgage. At a 7% rate over 30 years, that’s about $1,636 in principal and interest. Property taxes in Charleston County for an owner-occupied home run roughly $1,200-$1,800 a year, and homeowners insurance in coastal South Carolina runs higher than the national average — figure $2,500-$3,500. Add it up and your monthly carrying cost lands closer to $2,050-$2,150 before maintenance.
| Cost | Buy ($307K, 20% down) | Rent (avg) |
|---|---|---|
| Monthly payment | ~$2,100 | $1,712 |
| Up-front cash | $61,471 + closing | First/last + deposit |
| Annual difference | — | ~$4,656 cheaper |
Renting wins on monthly cash flow by about $400. It also wins on flexibility in a market where prices have fallen for a year straight. If you buy today and prices drop another 2-3%, you’ve lost more than the rent difference saves you.
That changes if you plan to stay seven-plus years and rates fall enough to refinance. Equity builds, the mortgage gets paid down, and the rent vs buy gap closes. For shorter horizons in a declining market, the math favors renting.
Population Growth and Migration
North Charleston is gaining people fast.
| Year | Population |
|---|---|
| 2020 | 115,613 |
| 2021 | 117,633 |
| 2022 | 118,745 |
| 2023 | 121,740 |
| 2024 | 126,005 |
That’s 10,392 new residents in four years — a 9.0% jump. The growth has accelerated, with 2023-2024 alone adding 4,265 people. Compare that pace to nearby cities:
| City | 2024 Population | 4-Year Growth |
|---|---|---|
| North Charleston | 126,005 | +9.0% |
| Goose Creek | 50,352 | +8.8% |
| Columbia | 144,788 | +6.3% |
| Mount Pleasant | 95,604 | +4.8% |
| Charleston | 157,665 | +4.4% |
| Greenville | 74,371 | +4.1% |
North Charleston is growing faster than every comparable South Carolina city in this dataset, including its neighbor Charleston (+4.4%) and the state capital Columbia (+6.3%).
So why are prices falling? Supply. Population growth alone doesn’t push prices up — when builders and sellers add inventory faster than buyers can absorb it, values slip even as the city expands. The 9% population gain says housing demand is real. The 2.8% price decline says supply has caught up with that demand, at least for now.
North Charleston Housing Market Trends
Twelve straight months. That’s how long the typical value has been moving down.
| Month | Typical Value | Monthly Change |
|---|---|---|
| Feb 2026 | $307,356 | +$687 |
| Jan 2026 | $306,669 | -$33 |
| Dec 2025 | $306,702 | -$775 |
| Nov 2025 | $307,477 | -$947 |
| Oct 2025 | $308,424 | -$922 |
| Sep 2025 | $309,346 | -$909 |
| Aug 2025 | $310,255 | -$1,594 |
| Jul 2025 | $311,849 | -$1,695 |
| Jun 2025 | $313,544 | -$1,497 |
| May 2025 | $315,041 | -$982 |
| Apr 2025 | $316,023 | -$310 |
| Mar 2025 | $316,333 | — |
The peak monthly drops came mid-summer 2025, when the market was shedding $1,500-$1,700 a month. By late 2025 the declines had shrunk to under $1,000. February 2026 actually posted a $687 gain — the first positive month in this window. One month doesn’t make a trend, but it’s a sign the slide may be losing steam.
Total drop from peak to current: $8,977, or 2.84%.
Is North Charleston a Good Place to Buy in 2026?
The data points to a buyer’s market, but a soft one.
You have the upper hand. Prices have fallen for a year, and four out of four ZIPs are below their March 2025 levels. Sellers know inventory has built up. Asking-price reductions and seller concessions on closing costs are realistic to negotiate.
You also have time. With prices grinding down at $700-$1,000 a month on average, there’s no urgency to write an offer above asking just to lock in. Waiting another 30-60 days to find the right home costs you almost nothing.
The risk: rates. If mortgage rates drop a full point in 2026, the savings on monthly payments could pull more buyers off the sidelines and put a floor under prices fast. Population is still climbing 4,000+ a year — the demand is there waiting for cheaper financing.
Bottom line: a patient buyer with cash for 20% down has the advantage right now. A buyer stretching their budget at current rates should think twice.
North Charleston Housing Market Outlook for 2026-2027
The 3-month trend tells a more interesting story than the 12-month average. From December 2025 to February 2026, prices moved -$33, +$687 — essentially flat with a small uptick in the most recent month. Compare that to the summer 2025 stretch when the market shed $1,500+ a month.
If the current pace continues, the worst of the decline is behind. The trajectory suggests prices stabilizing in the $305K-$310K range over the next three to six months rather than continuing to slide. A return to growth would require a clear catalyst — lower rates, tighter inventory, or both.
Population is still growing 4,000+ a year. That demand will eventually meet whatever supply level the market settles at. The question is when, not if.
Similar Markets in SC
- Charleston — the big neighbor across the line, with higher prices but slower population growth.
- Summerville — the closest commuter alternative for North Charleston buyers priced out of city limits.
- Columbia — South Carolina’s capital, larger and growing slower than North Charleston.
- Mount Pleasant — the upscale Charleston-area suburb on the other side of the harbor.
- Greenville — a different metro entirely, useful as a Upstate comparison point.
Frequently Asked Questions
What is the average home price in North Charleston?
The average home price in North Charleston, SC is $307,356 as of February 2026. That figure is based on the Zillow Home Value Index across the city’s four ZIP codes — 29405, 29406, 29418, and 29420.
Are home prices going up or down in North Charleston?
Prices are down 2.8% year over year. Values have slipped every month since the March 2025 peak of $316,333, though the most recent reading shows the first monthly uptick in a year.
Is it cheaper to rent or buy in North Charleston?
Renting is cheaper. Average rent runs about $1,712 a month, while a typical mortgage payment on a $307K home with 20% down lands closer to $2,100 once property taxes and South Carolina coastal insurance are added.
What is the most affordable neighborhood in North Charleston?
ZIP 29406 is the cheapest at $293,899, about 4.4% below the city average. ZIP 29418 follows at $295,930, just $2,000 higher. Both also have the lowest rents in the city.
Methodology
Home values are based on the Zillow Home Value Index (ZHVI), a smoothed measure of typical home values in the 35th to 65th percentile range. Rent estimates use the Zillow Observed Rent Index (ZORI). Population figures come from the U.S. Census Bureau Population Estimates Program (2020-2024 vintage). All datasets are publicly available. Housing data updated 2026-02-28.