Toms River Home Prices: $412K, Up 2.3% — 4 ZIPs Analyzed (2026)
$412,400. That’s what a typical home costs in Toms River right now. Prices climbed 2.3% over the past year, and the gap between the cheapest and most expensive ZIP codes is nearly $250,000.
Quick answer: The average home price in Toms River, NJ is $412,400 as of February 2026, up 2.3% year over year according to Zillow.
Current Home Prices in Toms River
Toms River sits within the New York-Newark-Jersey City metro area, but its prices run well below Manhattan or even Jersey City levels. Here’s a snapshot of where things stand.
| Metric | Value |
|---|---|
| Median Home Value | $412,400 |
| Year-over-Year Change | +2.3% |
| Lowest ZIP Median | $274,053 |
| Highest ZIP Median | $522,738 |
| Number of ZIPs Tracked | 4 |
| Data As Of | February 2026 |
A 2.3% annual gain is modest. It means a home worth $400,000 a year ago added roughly $9,200 in value. That’s not the kind of appreciation that makes headlines, but it’s steady. Homeowners aren’t losing equity, and buyers aren’t being priced out at the speed you see in hotter markets.
The spread between the cheapest and most expensive neighborhoods tells a bigger story. You can find a home under $275,000 in one part of town and pay over $520,000 in another. Same city, same school district umbrella, vastly different price tags.
For buyers with flexibility on location within Toms River, that range creates real options.
Toms River Home Prices by Neighborhood
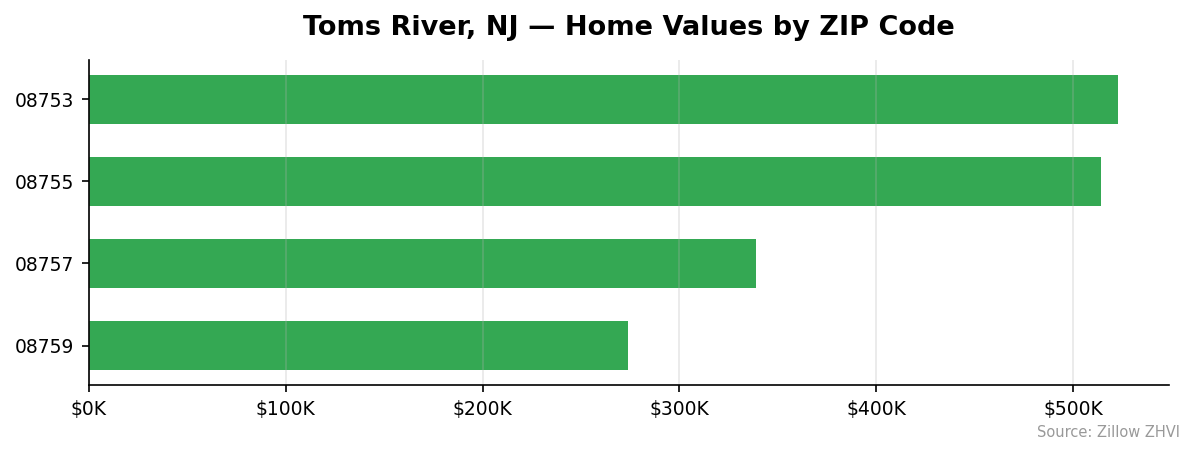
Four ZIP codes cover Toms River, and they split into two tiers: the $500K+ areas and the sub-$340K areas.
| ZIP Code | Median Home Value | Rent (ZORI) |
|---|---|---|
| 08753 | $522,738 | $2,656/mo |
| 08755 | $513,944 | $3,550/mo |
| 08757 | $338,863 | Data not available |
| 08759 | $274,053 | Data not available |
Most Expensive
08753 leads at $522,738, roughly 27% above the city median, with rents at $2,656 per month — relatively moderate given home prices.
08755 follows closely at $513,944, but its rents are the highest in the city at $3,550 per month, suggesting strong rental demand in this area.
Most Affordable
08757 comes in at $338,863, about 18% below the city average — a middle-ground option.
08759 is the clear budget pick at $274,053, a full 34% below the Toms River median. Rent data isn’t available for this ZIP, but the low home values make it the entry point for buyers on a tighter budget.
Rent vs Buy in Toms River
Rent data is available for two of the four ZIP codes, which gives a partial picture.
In 08753, the typical rent is $2,656 per month. A buyer purchasing the median home there ($522,738) with 20% down at a 7% mortgage rate would pay roughly $2,780 per month in principal and interest alone. Add property taxes and insurance, and ownership costs run well above rent. Renting is cheaper in this ZIP on a pure monthly cash flow basis.
In 08755, rent hits $3,550 per month. The median home value is $513,944. The same mortgage math gives you about $2,735 in monthly principal and interest. Here, buying is cheaper than renting before you even factor in equity building.
That’s a stark difference between two neighboring ZIPs. In 08755, renters are paying a premium. In 08753, buyers are.
If you’re deciding between the two, the rent-to-price ratio in 08755 makes a stronger case for buying. But don’t ignore property taxes — New Jersey has some of the highest in the country, and that changes the math.
Toms River Housing Market Trends
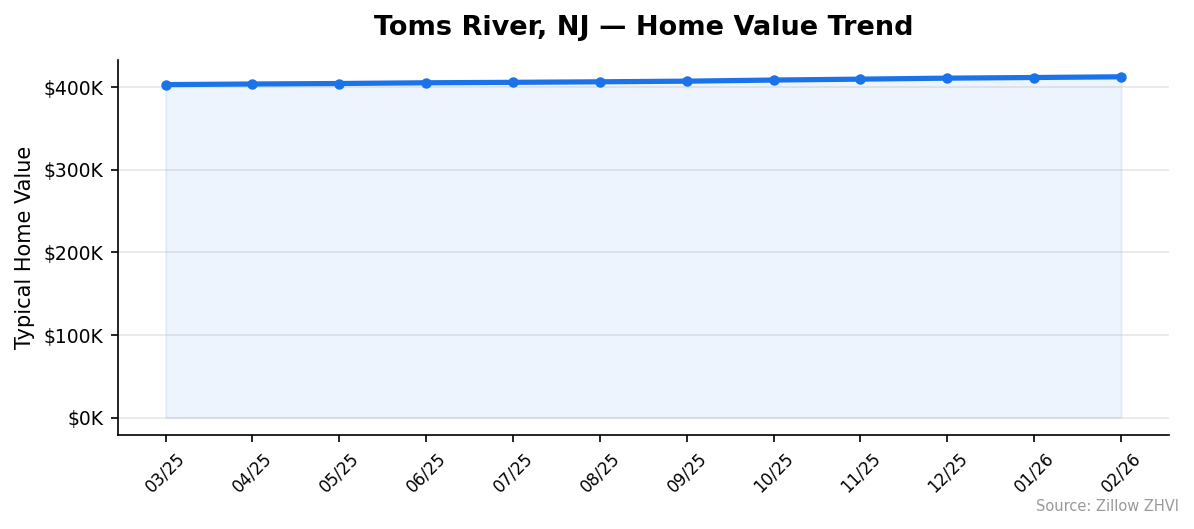
Prices moved in one direction over the past year: up. Every single month saw gains.
| Month | Average Value | Low (ZIP) | High (ZIP) |
|---|---|---|---|
| Feb 2026 | $412,400 | $274,053 | $522,738 |
| Jan 2026 | $411,529 | $274,310 | $521,182 |
| Dec 2025 | $410,755 | $274,625 | $519,637 |
| Nov 2025 | $409,551 | $274,754 | $517,468 |
| Oct 2025 | $408,459 | $275,162 | $515,345 |
| Sep 2025 | $407,110 | $275,749 | $512,978 |
| Aug 2025 | $406,337 | $277,093 | $511,133 |
| Jul 2025 | $405,698 | $278,087 | $509,615 |
| Jun 2025 | $405,158 | $278,794 | $508,147 |
| May 2025 | $404,279 | $278,212 | $506,814 |
| Apr 2025 | $403,675 | $277,593 | $506,087 |
| Mar 2025 | $402,954 | $276,725 | $505,602 |
The city average gained about $9,450 over 12 months. But notice something in the low-end column: the cheapest ZIP actually fell from $278,794 in June 2025 to $274,053 in February 2026. While the expensive areas pulled the average up, the most affordable pocket of Toms River got slightly cheaper.
The high end tells the opposite story. The priciest ZIP jumped from $505,602 to $522,738 — a $17,136 gain. The gap between rich and affordable Toms River is widening.
Is Toms River a Good Place to Buy in 2026?
The numbers point to a stable market with a mild upward tilt. A 2.3% annual gain won’t make you rich on appreciation, but it won’t leave you underwater either.
For buyers, the math works best in the affordable ZIPs. A home in 08759 at $274,053 is accessible with a conventional loan and modest down payment. Monthly payments on that purchase would be substantially lower than rents in the higher-end ZIPs.
The risk? The cheapest ZIP is trending slightly downward in value. If you buy in 08759, you’re betting the trend reverses or at least stabilizes.
For the $500K+ ZIPs, you’re paying a premium but getting areas with strong rental demand. If you ever need to convert to a rental property, 08755’s $3,550 monthly rents offer a cushion.
Toms River isn’t a speculative play. It’s a buy-and-hold market where steady appreciation and reasonable entry points make the case.
Toms River Housing Market Outlook for 2026-2027
The 12-month trend shows consistent, small monthly gains averaging about $790 per month. No month saw a decline. That kind of consistency suggests the upward pressure isn’t seasonal — it’s structural.
If the current pace continues, expect the city median to push toward $420,000 by late 2026. The expensive ZIPs could approach $540,000.
The affordable end is harder to predict. The cheapest ZIP has been quietly losing value while the city average rises. That divergence can’t last forever. Either the low end stabilizes and catches up, or the overall average growth slows.
Watch mortgage rates. At 7%, the monthly cost of ownership is already tight against rents. A drop to 6.5% would shift the rent-vs-buy math in favor of buying across all ZIPs.
Similar Markets in NJ
If you’re shopping in New Jersey and Toms River’s $412K median is close to your budget, these cities are worth comparing.
- Jersey City — urban living with PATH train access to Manhattan, expect higher prices.
- Edison — central NJ location popular with families, strong school reputation.
- Cherry Hill — south Jersey option closer to Philadelphia, a different commute profile entirely.
- Clifton — north Jersey alternative in Passaic County with easy access to Route 3 and the Turnpike.
- Trenton — the state capital typically offers lower price points for budget-focused buyers.
Frequently Asked Questions
What is the average home price in Toms River?
The average home price in Toms River is $412,400 as of February 2026. Prices range from $274,053 in ZIP 08759 to $522,738 in ZIP 08753. That’s a $248,685 spread across just four ZIP codes.
Are home prices going up or down in Toms River?
Prices are going up. The year-over-year increase is 2.3%, and values rose every month from March 2025 through February 2026. The growth is modest but unbroken — no monthly dips in the past year.
Is it cheaper to rent or buy in Toms River?
It depends where. In ZIP 08755, rent averages $3,550/month while a mortgage on the median home runs about $2,735/month in principal and interest — buying wins. In ZIP 08753, rent is $2,656/month versus roughly $2,780 in mortgage costs, making renting slightly cheaper on a monthly basis.
What is the most affordable neighborhood in Toms River?
ZIP code 08759 has the lowest median home value at $274,053, about $138,000 below the city average. It’s the only area in Toms River where you can buy under $300,000.
Methodology
Home values are based on the Zillow Home Value Index (ZHVI), a smoothed measure of typical home values in the 35th to 65th percentile range. Rent estimates use the Zillow Observed Rent Index (ZORI). Population figures come from the U.S. Census Bureau Population Estimates Program (2020-2024 vintage). All datasets are publicly available. Housing data updated 2026-02-28.