Valparaiso Home Prices: $304K, Up 1.9% — 3 ZIPs Analyzed (2026)
$304,468. That’s what the typical home in Valparaiso, IN is worth as of February 2026. Prices are up 1.9% from a year ago, and the market has added value for eight straight months.
Quick answer: The average home price in Valparaiso, IN is $304,468 as of February 2026, up 1.9% year over year according to Zillow.
Current Home Prices in Valparaiso
The Valparaiso market sits firmly in the middle of Indiana’s price spectrum. It’s pricier than Lafayette or Fort Wayne but well below the Chicago suburbs across the border in Illinois.
| Metric | Value |
|---|---|
| Median home value | $304,468 |
| Year-over-year change | +1.9% |
| Lowest ZIP value | $211,362 |
| Highest ZIP value | $364,263 |
| Price spread | $152,901 |
| Metro area | Chicago-Naperville-Elgin, IL-IN-WI |
| ZIPs analyzed | 3 |
The spread between the cheapest and most expensive ZIP is $152,901. That’s a 72% gap. For a city of roughly 35,000 people, that range matters. Where you draw the boundary changes the kind of home you can afford by a lot.
The Chicago metro tag is technically accurate but a little misleading. Valparaiso sits about an hour southeast of downtown Chicago in Porter County. The commuter rail runs through, but most buyers here work locally or in the Northwest Indiana industrial corridor. You’re paying Indiana prices with a Chicago metro postal label.
A 1.9% annual gain is modest. It’s faster than wage growth in most of the state but slower than what Carmel or Fishers buyers saw the same year. For a buyer, this means the window isn’t slamming shut — but it isn’t reopening either.
Valparaiso Home Prices by Neighborhood
Three ZIPs cover the city. Two contain the bulk of housing stock and rental supply. The third is significantly cheaper and pulls the floor of the market down.
| ZIP | Median Value | vs. City Avg | Avg Rent |
|---|---|---|---|
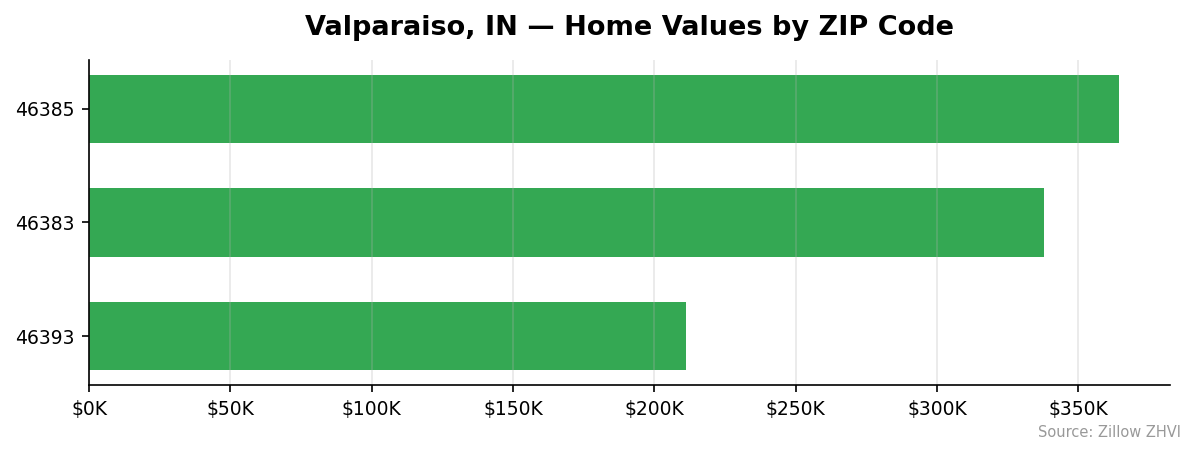
| 46385 | $364,263 | +20% | $1,776 |
| 46383 | $337,778 | +11% | $1,382 |
| 46393 | $211,362 | -31% | Not reported |
Most Expensive
46385 tops the list at $364,263. It also pulls the highest rents in the city at $1,776 — a sign that demand is strong on both the buy and rent sides.
46383 sits in the middle at $337,778. It’s the larger of the two main residential ZIPs and shows a softer rent figure of $1,382, suggesting more rental supply or older stock.
Most Affordable
46393 is the bargain at $211,362, roughly $93,000 below the city median. Rent data isn’t reported for this ZIP, which usually means the rental market is too small to track reliably.
If you’re looking under $250K in Valparaiso, 46393 is essentially the only ZIP that delivers at the median.
Rent vs Buy in Valparaiso
The two ZIPs with rent data average about $1,579 per month. That’s $18,948 a year.
Compare that to ownership. On a $304,468 home with 20% down, you’d finance roughly $243,574. At a typical mortgage rate, principal and interest land near $1,600 to $1,650. Add property taxes, insurance, and maintenance and you’re closer to $2,000 a month all-in.
So renting beats buying by roughly $400 a month on a cash-flow basis. That’s the short answer.
| Cost Factor | Rent | Buy |
|---|---|---|
| Monthly cash outlay | ~$1,579 | ~$2,000 |
| Down payment required | $0 | ~$60,900 |
| Builds equity | No | Yes |
| Locked-in payment | No | Yes (P&I portion) |
The price-to-rent ratio comes out to roughly 16. That’s the threshold where most analysts say the math starts favoring ownership — assuming you stay put long enough to recover closing costs and the down payment. If you’re moving in two or three years, rent. If you’re staying five-plus and prices keep their 1.9% pace, buying gets you ahead.
ZIP 46385 carries the highest rents, which makes ownership there a closer call. ZIP 46383, with rents around $1,382, is firmly cheaper to rent than to own.
Population Growth and Migration
Valparaiso added 895 residents between 2020 and 2024 — a 2.6% gain. Slow and steady, not a boom.
| Year | Population |
|---|---|
| 2020 | 34,170 |
| 2021 | 34,485 |
| 2022 | 34,606 |
| 2023 | 34,621 |
| 2024 | 35,065 |
Growth nearly stalled in 2023, then jumped by 444 people in 2024. That’s the strongest single-year gain in the period. It’s worth watching whether 2025 confirms a faster pace or returns to the flat trend of 2022-2023.
How does Valparaiso compare to other Indiana cities?
| City | 2024 Population | 4-Year Growth |
|---|---|---|
| Noblesville | 75,239 | +7.2% |
| Fishers | 103,986 | +4.5% |
| Carmel | 103,606 | +3.7% |
| Fort Wayne | 273,203 | +3.3% |
| Valparaiso | 35,065 | +2.6% |
| Lafayette | 71,757 | +1.4% |
Valparaiso grows slower than the Indianapolis suburbs but faster than Lafayette. The Indy metro is pulling in the bulk of the state’s new residents. Valparaiso is holding its own as a smaller commuter and college town.
For housing demand, slow growth means slow price gains — which lines up with the 1.9% the market actually delivered.
Valparaiso Housing Market Trends
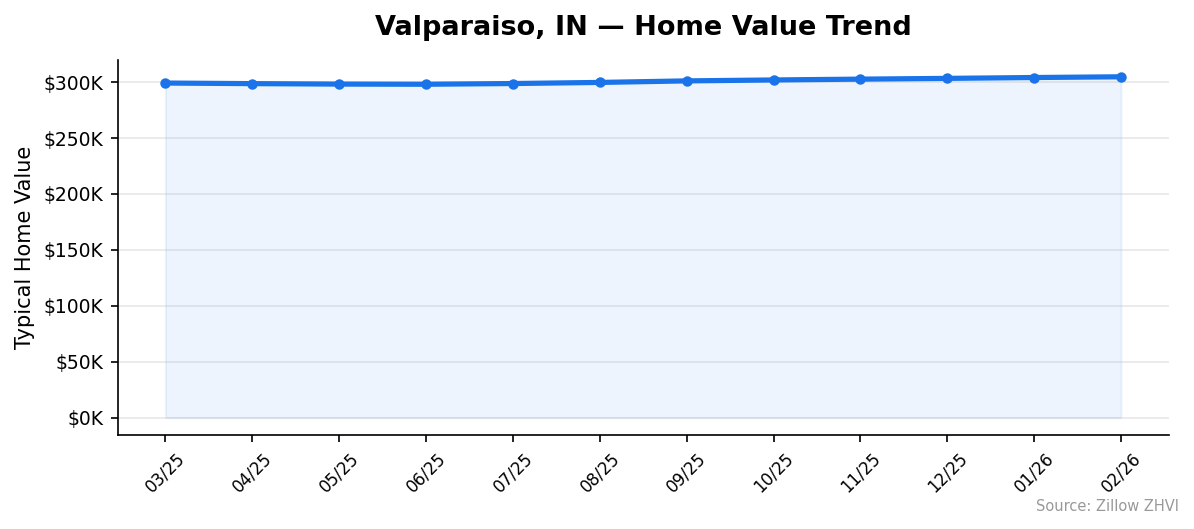
The 12-month picture shows a market that softened in spring, hit bottom in early summer, then climbed steadily through winter.
| Month | Median Value |
|---|---|
| 2026-02-28 | $304,468 |
| 2026-01-31 | $303,815 |
| 2025-12-31 | $303,045 |
| 2025-11-30 | $302,374 |
| 2025-10-31 | $301,635 |
| 2025-09-30 | $300,801 |
| 2025-08-31 | $299,435 |
| 2025-07-31 | $298,444 |
| 2025-06-30 | $297,802 |
| 2025-05-31 | $297,948 |
| 2025-04-30 | $298,352 |
| 2025-03-31 | $298,873 |
Values dropped from $298,873 in March 2025 to a low of $297,802 in June. That’s about a $1,000 dip. Then the market reversed.
From June to February, the median climbed $6,666 — a 2.2% gain in eight months. The pace has been remarkably consistent at $600 to $850 per month.
This isn’t a boom. It’s not a correction. It’s a market grinding higher at a steady, predictable pace.
Is Valparaiso a Good Place to Buy in 2026?
The conditions tilt toward a balanced market with a slight edge to sellers.
Eight consecutive months of price gains means buyers don’t have much room to demand big concessions. But the gains are small enough — under 1% per quarter — that you’re not racing the clock.
If you’re buying as an owner-occupant and plan to stay five-plus years, the data supports a purchase. The price-to-rent ratio of 16 is reasonable. Population growth is positive. The price floor in ZIP 46393 keeps entry-level options open under $250K.
If you’re an investor, the rent-to-price math is tighter. Gross yields work out to roughly 6% in 46385 and just under 5% in 46383. You’ll need cost discipline and ideally to find sub-median properties to make the numbers work.
If you’re moving in two or three years, rent. The transaction costs of buying and selling will likely eat any appreciation gains.
Valparaiso Housing Market Outlook for 2026-2027
The 3-month trend shows the median rising about $700 per month. If the current pace continues, Valparaiso clears $310,000 by mid-2026 and approaches $315,000 by year-end.
That would put 2026 full-year appreciation around 3% to 4% — slightly faster than the 1.9% trailing year. The acceleration tracks the August-to-February momentum visible in the monthly data.
A few things could break the trend. A sharper rate cut would likely speed gains as buyers come off the sidelines. A regional employment shock in the Northwest Indiana industrial corridor would slow them. Without either signal in the data, the most reasonable expectation is more of the same: steady, modest, single-digit gains.
The bottom of the market in 46393 has been the slowest mover, gaining only about $5,500 over 12 months. That ZIP should be the last to reflect any acceleration.
Similar Markets in IN
If Valparaiso’s $304K median is too high or too low, other Indiana cities offer different trade-offs:
- Lafayette — A college town with slower population growth and typically lower prices than Valparaiso.
- Fort Wayne — Indiana’s second-largest city with a deeper inventory and broader price range.
- Indianapolis — The state’s biggest market with the widest selection across price points.
- Carmel — A wealthier Indianapolis suburb where buyers should expect to pay well above Valparaiso prices.
- Fishers — Another fast-growing Indy suburb with stronger appreciation than Valparaiso has shown.
Frequently Asked Questions
What is the average home price in Valparaiso?
The typical home in Valparaiso, IN is worth $304,468 as of February 2026. That number reflects the middle slice of the market — homes between roughly the 35th and 65th percentile of value. Luxury properties and distressed sales are excluded.
Are home prices going up or down in Valparaiso?
Prices are up 1.9% over the past year. The market has gained value every month since July 2025, with the median climbing from $297,802 to $304,468 — a $6,666 increase over eight months.
Is it cheaper to rent or buy in Valparaiso?
Renting is cheaper on a monthly basis. Average rents in the two ZIPs with data run about $1,579, while the all-in monthly cost of owning the median home runs closer to $2,000. The price-to-rent ratio of 16 means buying makes more sense if you’re staying five years or longer.
What is the most affordable neighborhood in Valparaiso?
ZIP 46393 is the cheapest at $211,362 — about 31% below the city average. The two main residential ZIPs, 46383 and 46385, both sit above $337,000, so 46393 is the only ZIP delivering median values under $250K.
Methodology
Home values are based on the Zillow Home Value Index (ZHVI), a smoothed measure of typical home values in the 35th to 65th percentile range. Rent estimates use the Zillow Observed Rent Index (ZORI). Population figures come from the U.S. Census Bureau Population Estimates Program (2020-2024 vintage). All datasets are publicly available. Housing data updated 2026-02-28.