Fishers Home Prices: $443K, Up 1.5% — 3 ZIPs Analyzed (2026)
$443,303. That’s the typical home value in Fishers, IN as of February 2026. Prices are up 1.5% from a year ago — a modest climb, but the third straight month of gains.
Quick answer: The average home price in Fishers, IN is $443,303 as of February 2026, up 1.5% year over year according to Zillow.
Current Home Prices in Fishers
Fishers home values sit just under the $450K line. The market has drifted upward since last summer without any sharp moves in either direction.
| Metric | Value |
|---|---|
| Median home value | $443,303 |
| Year-over-year change | +1.5% |
| Cheapest ZIP | $373,683 (46038) |
| Most expensive ZIP | $491,214 (46040) |
| Price spread across ZIPs | $117,531 |
| ZIP codes tracked | 3 |
| Data month | February 2026 |
The gap between the cheapest and priciest ZIP is roughly $117,000. That’s a 31% difference within the same city — not huge by national standards, but enough to shape where buyers land.
For context, Fishers prices sit well above the $300K range typical of Indiana as a whole. The city has tracked closer to Carmel and the northern Indianapolis suburbs than to the rest of the state.
The 1.5% yearly gain is slower than the run-up many buyers remember from 2021-2022. It also trails inflation. In real terms, Fishers homeowners are treading water rather than building equity through appreciation.
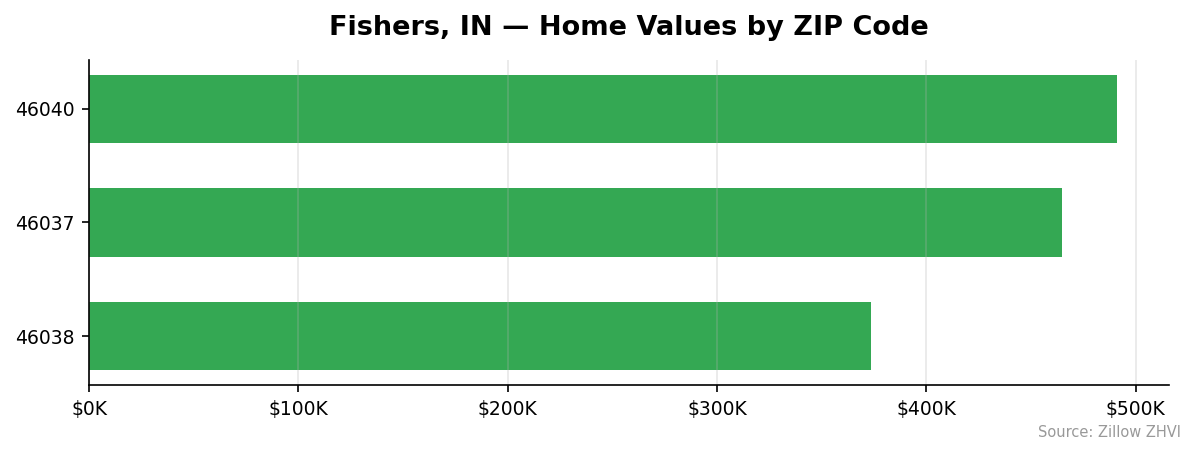
Fishers Home Prices by Neighborhood
Three ZIP codes cover Fishers. The spread between them is meaningful.
| ZIP | Median Value | Monthly Rent (ZORI) |
|---|---|---|
| 46040 | $491,214 | $1,874 |
| 46037 | $465,014 | $1,903 |
| 46038 | $373,683 | $1,690 |
Most Expensive
- 46040 — $491,214, the top of the market and roughly 11% above the city average, with rents near $1,874.
- 46037 — $465,014, about 5% above the Fishers average and carrying the highest rents in the city at $1,903.
- No third high-end ZIP exists — Fishers only has three ZIPs total.
Most Affordable
- 46038 — $373,683, the only ZIP under $400K and about $70,000 below the city median, with rents near $1,690.
- 46037 — at $465,014, it’s the middle tier but still far from the entry point.
- 46040 — the priciest option, so not affordable by Fishers standards.
If you want in under $400K in this market, 46038 is effectively your only option.
Rent vs Buy in Fishers
Rents across the three ZIPs average about $1,822 per month. The cheapest rental ZIP is 46038 at $1,690.
Run the buy-side math. A $443,303 home with 20% down leaves a $354,642 loan. At a 7% fixed 30-year rate, principal and interest alone come to roughly $2,360 per month. Add property taxes and insurance — call it $450 combined for Indiana — and the all-in payment lands near $2,810.
That’s nearly $1,000 more per month than the typical Fishers rent.
| Cost | Monthly |
|---|---|
| Average Fishers rent | ~$1,822 |
| Median-priced mortgage (20% down, taxes, insurance) | ~$2,810 |
| Difference | ~$988 |
Buying still makes sense if you plan to stay more than five to seven years and value the equity build. For shorter timelines, the math favors renting. The 1.5% annual appreciation doesn’t cover the monthly premium you’re paying to own.
One caveat: rent figures from ZORI reflect what new leases are signing for, not what long-time tenants pay. If you’ve been in place for years, your actual rent may be lower.
Population Growth and Migration
Fishers had 103,986 residents in 2024, up from 99,502 in 2020. That’s a 4.5% gain over four years.
| Year | Population |
|---|---|
| 2020 | 99,502 |
| 2021 | 101,478 |
| 2022 | 102,398 |
| 2023 | 104,381 |
| 2024 | 103,986 |
Growth peaked in 2023 at 104,381 and dipped slightly the following year. The city is still expanding overall, just at a slower pace than earlier in the decade.
Here’s how Fishers stacks against other Indiana cities:
| City | 2024 Population | 4-Year Growth |
|---|---|---|
| Fort Wayne | 273,203 | +3.3% |
| Fishers | 103,986 | +4.5% |
| Carmel | 103,606 | +3.7% |
| Noblesville | 75,239 | +7.2% |
| Lafayette | 71,757 | +1.4% |
Fishers grew faster than Carmel, its closest suburban rival, but Noblesville is outpacing both. The Indianapolis metro as a whole continues to pull in new residents, which keeps baseline housing demand steady.
Rising population plus slow price growth is an unusual combo. It suggests supply is mostly keeping up — new construction in the area is meeting demand instead of letting it bid up resale prices.
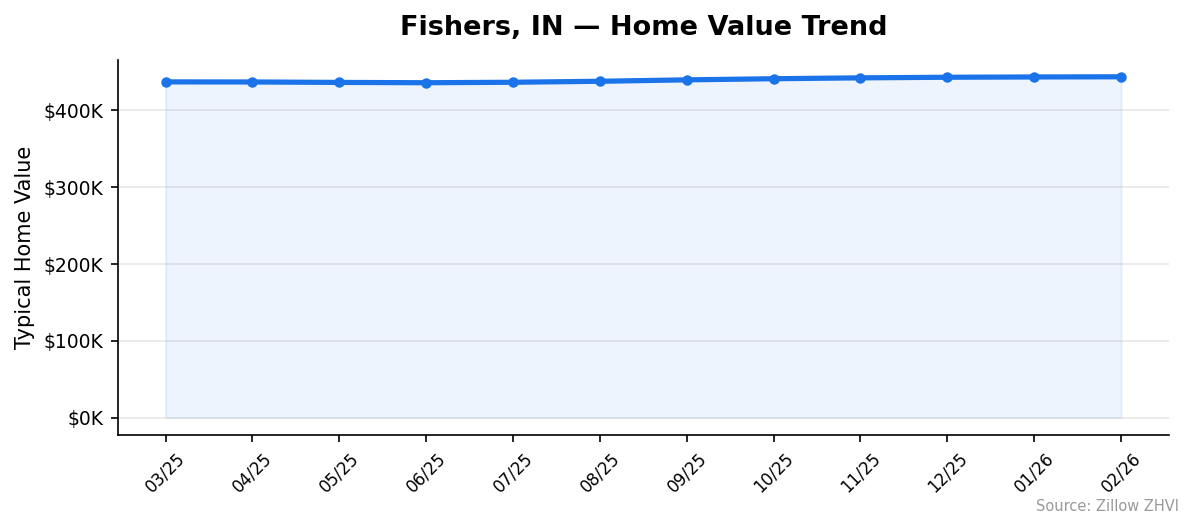
Fishers Housing Market Trends
Twelve months of Zillow data show a gentle but consistent climb.
| Month | Avg Value |
|---|---|
| Feb 2026 | $443,303 |
| Jan 2026 | $443,076 |
| Dec 2025 | $442,699 |
| Nov 2025 | $441,930 |
| Oct 2025 | $440,785 |
| Sep 2025 | $439,312 |
| Aug 2025 | $437,469 |
| Jul 2025 | $436,175 |
| Jun 2025 | $435,579 |
| May 2025 | $435,985 |
| Apr 2025 | $436,554 |
| Mar 2025 | $436,681 |
The low point came in June 2025 at $435,579. Since then, values have added about $7,700 — a 1.8% gain over eight months.
No month showed a decline steeper than $400. No month showed a gain larger than $2,000. The pattern is smooth, not volatile.
This kind of flat-to-rising chart usually means neither side of the market has the upper hand. Sellers aren’t slashing prices, but buyers aren’t bidding wars either.
Is Fishers a Good Place to Buy in 2026?
The data points to a balanced market with mild appreciation.
Arguments for buying now:
- Prices are climbing, not falling. Waiting costs you roughly $600 per month in forgone appreciation.
- Population is growing, which supports long-term demand.
- Fishers sits in the Indianapolis metro, so job market depth is there.
Arguments against:
- Renting saves nearly $1,000 a month at current rates.
- Appreciation of 1.5% annually won’t cover transaction costs if you move within three years.
- The 2023-to-2024 population dip is worth watching — if it turns into a trend, demand softens.
Fishers is not a speculative market. It rewards patience and long holds, not flipping. If you’re moving for a job at Roche, Lilly, or one of the area’s other large employers and plan to stay, the math works. If you’re hoping to cash in on fast gains, this isn’t that market.
Fishers Housing Market Outlook for 2026-2027
The 12-month trend shows Fishers adding roughly $600 to $1,500 per month in typical value since last summer. Momentum has been slowly accelerating — the three-month gain from December to February was stronger than the gain from June to September.
If the current pace continues, prices could reach the $450K mark by late summer 2026. That would put yearly appreciation closer to 2% than the current 1.5%.
Risks to this outlook: mortgage rates staying near 7% will keep some buyers sidelined, and the 2024 population dip bears watching for signs of softening demand. Indiana property tax changes could also shift the buy-vs-rent math.
The trend suggests a continuation of the slow, steady pattern rather than a breakout in either direction. Buyers waiting for a price crash probably won’t get one here.
Similar Markets in IN
- Carmel — Fishers’ closest neighbor in price and demographics. Worth comparing if you want similar school quality at a different price point.
- Indianapolis — the metro core. Far cheaper entry points for buyers willing to trade suburban amenities for urban access.
- Fort Wayne — a larger city with slower growth and lower prices across the board.
- Bloomington — a college town with different market dynamics and a younger renter base.
- Lafayette — another college-anchored market with weaker population growth and lower prices.
Frequently Asked Questions
What is the average home price in Fishers?
The average home price in Fishers, IN is $443,303 as of February 2026. That figure represents the Zillow Home Value Index across the city’s three ZIP codes — 46037, 46038, and 46040. Individual homes in the city range from roughly $374K on the low end to $491K on the high end.
Are home prices going up or down in Fishers?
Prices are up 1.5% year over year. The market bottomed at $435,579 in June 2025 and has climbed steadily since, adding about $7,700 through February 2026. The pace is modest but consistent — no month in the last year showed a meaningful decline.
Is it cheaper to rent or buy in Fishers?
Renting is cheaper on a monthly basis. Typical Fishers rent averages around $1,822, while a 20%-down mortgage on a median-priced home runs about $2,810 including taxes and insurance at a 7% rate. Buying makes more sense if you plan to stay more than five to seven years and build equity.
What is the most affordable neighborhood in Fishers?
ZIP 46038 is the most affordable at $373,683 — about $70,000 below the city median and the only ZIP under $400K. Rent there also runs lower at about $1,690 per month compared to $1,874 and $1,903 in the other two ZIPs.
Methodology
Home values are based on the Zillow Home Value Index (ZHVI), a smoothed measure of typical home values in the 35th to 65th percentile range. Rent estimates use the Zillow Observed Rent Index (ZORI). Population figures come from the U.S. Census Bureau Population Estimates Program (2020-2024 vintage). All datasets are publicly available. Housing data updated 2026-02-28.