Average Home Price in Bakersfield CA (2026): Trends & Market Data
$389,172. That’s what a typical home costs in Bakersfield right now. Prices slipped 0.5% over the past year — a mild dip that barely registers in a market where homes still range from $290K to $567K depending on the neighborhood.
Quick answer: The average home price in Bakersfield, CA is $389,172 as of February 2026, down 0.5% year over year according to Zillow.
Current Home Prices in Bakersfield
Here’s where Bakersfield stands as of February 2026:
| Metric | Value |
|---|---|
| Median Home Value | $389,172 |
| Year-over-Year Change | -0.5% |
| Lowest ZIP Median | $290,167 |
| Highest ZIP Median | $567,207 |
| Number of ZIP Codes Tracked | 9 |
A 0.5% annual decline translates to roughly $1,950 lost in value over 12 months. That’s not a crash. It’s closer to a pause.
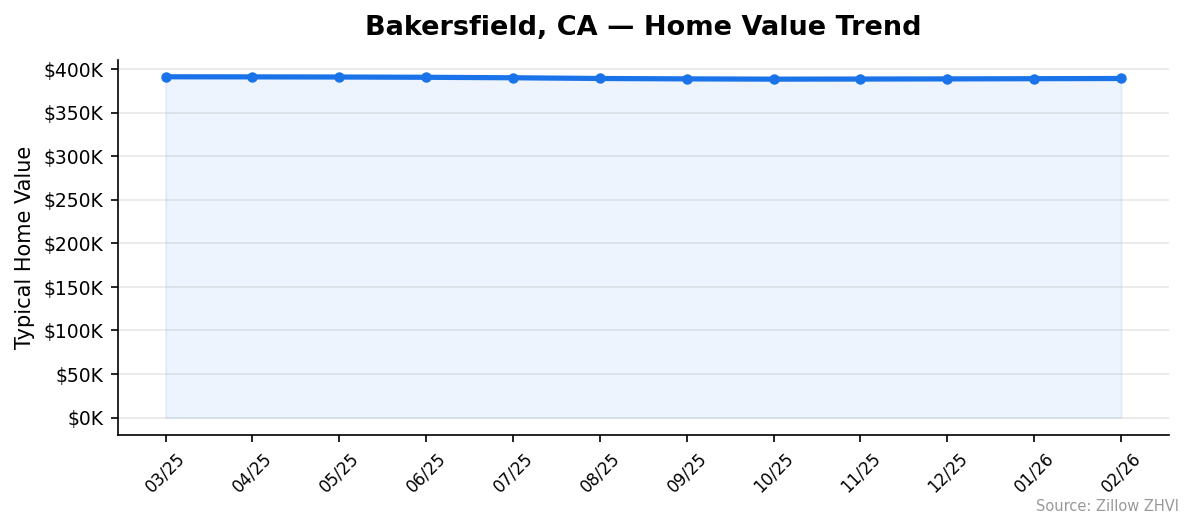
For context, Bakersfield peaked at an average of $391,120 in March 2025. Prices drifted lower through the summer and fall, bottoming out near $388,409 in October 2025. Since then, there’s been a modest uptick — three straight months of small gains heading into 2026.
If you bought at the March 2025 peak, you’re sitting on a paper loss of less than $2,000. Hardly enough to lose sleep over, but it tells you this market isn’t racing upward either.
The spread between the cheapest and most expensive ZIP codes is $277,039. That gap means your experience of the Bakersfield market depends heavily on where you’re looking.
Bakersfield Home Prices by Neighborhood
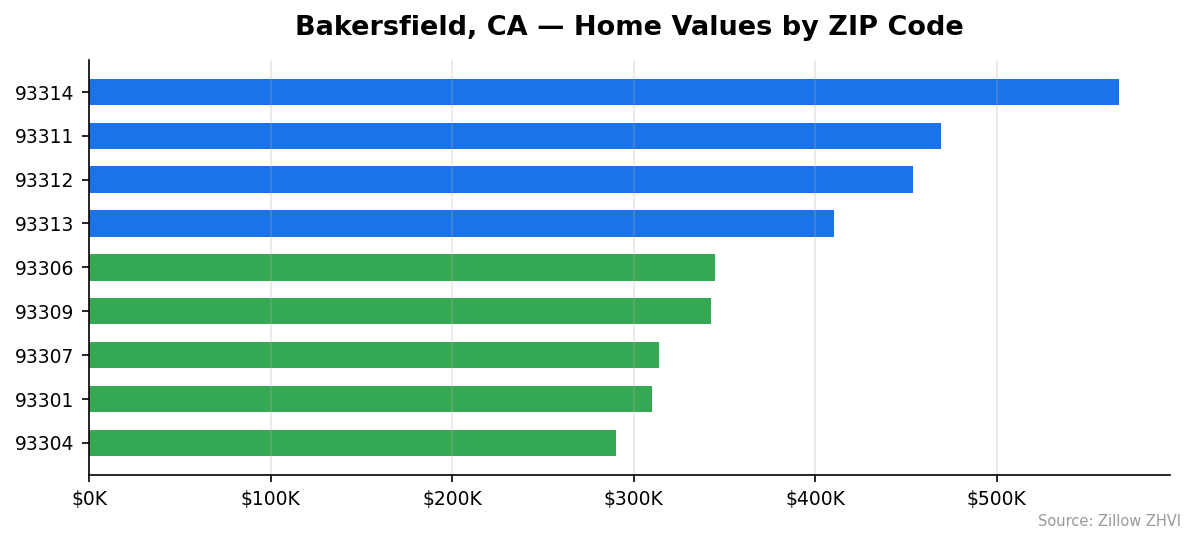
All nine tracked ZIP codes, ranked from most to least expensive:
| ZIP Code | Median Home Value | Avg Monthly Rent |
|---|---|---|
| 93314 | $567,207 | $2,169 |
| 93311 | $469,239 | $2,148 |
| 93312 | $453,742 | $2,334 |
| 93313 | $410,189 | $2,349 |
| 93306 | $344,865 | $1,827 |
| 93309 | $342,806 | $1,528 |
| 93307 | $314,061 | $1,725 |
| 93301 | $310,273 | $1,295 |
| 93304 | $290,167 | $1,389 |
Most Expensive Areas
93314 leads at $567,207 — 46% above the city median, with rents averaging $2,169/month. 93311 comes in at $469,239, roughly $80K above the citywide average, paired with rents near $2,148. 93312 rounds out the top three at $453,742, and notably carries the second-highest rents in the city at $2,334/month.
Most Affordable Areas
93304 is the cheapest place to buy in Bakersfield at $290,167, a full $99K below the city median, with the second-lowest rents at $1,389. 93301 sits at $310,273 and offers the lowest rents in the city — just $1,295/month. 93307 comes in at $314,061 with rents of $1,725, making it a mid-range option for renters despite its lower purchase price.
Rent vs Buy in Bakersfield
Here’s the basic math. The citywide average rent across all nine ZIP codes is approximately $1,851/month.
A mortgage on a $389,172 home with 20% down ($77,835) leaves a $311,337 loan. At a 7% rate over 30 years, the principal and interest payment runs about $2,071/month. Add property taxes and insurance, and you’re likely above $2,400.
| Cost | Monthly |
|---|---|
| Average Rent | ~$1,851 |
| Mortgage (P&I, 20% down, 7%) | ~$2,071 |
| Estimated Total with Tax/Insurance | ~$2,400+ |
Renting saves you roughly $200-550/month depending on how you calculate ownership costs. But renters build no equity.
The rent-to-buy equation varies sharply by neighborhood. In 93313, rents hit $2,349 — nearly matching a mortgage payment on a $410K home. Buying there makes more financial sense relative to renting. In 93301, rents are just $1,295, making renting significantly cheaper than owning.
If you have the down payment and plan to stay five-plus years, buying at today’s flat prices locks in your housing cost. If you’re not sure how long you’ll stay, renting gives you flexibility without the overhead.
Population Growth and Migration
Bakersfield’s population hit 417,468 in 2024, up 3.0% from 405,220 in 2020. That’s about 12,248 new residents in four years.
| Year | Population |
|---|---|
| 2020 | 405,220 |
| 2021 | 409,542 |
| 2022 | 412,996 |
| 2023 | 414,626 |
| 2024 | 417,468 |
Growth has been steady each year, with no dips. The city added roughly 3,000-4,000 residents annually.
How does that compare to other California cities?
| City | Population (2024) | 4-Year Growth |
|---|---|---|
| Bakersfield | 417,468 | 3.0% |
| Sacramento | 535,798 | 1.9% |
| San Diego | 1,404,452 | 1.4% |
| Fresno | 550,105 | 1.4% |
| Stockton | 324,975 | 1.2% |
| Oakland | 443,554 | 0.6% |
Bakersfield is growing faster than every major California city on this list. At more than double the rate of San Diego and Fresno, and five times faster than Oakland.
More people means more housing demand. Yet prices still slipped 0.5% year over year. That suggests supply has kept pace — for now.
Bakersfield Housing Market Trends
Month-by-month values over the past year:
| Month | Avg Home Value | Low | High |
|---|---|---|---|
| Mar 2025 | $391,120 | $292,634 | $566,718 |
| Apr 2025 | $391,017 | $292,005 | $567,141 |
| May 2025 | $390,865 | $291,611 | $567,700 |
| Jun 2025 | $390,552 | $291,258 | $567,830 |
| Jul 2025 | $389,998 | $291,097 | $567,488 |
| Aug 2025 | $389,175 | $290,839 | $566,419 |
| Sep 2025 | $388,723 | $290,694 | $565,977 |
| Oct 2025 | $388,409 | $290,225 | $565,885 |
| Nov 2025 | $388,540 | $289,967 | $566,488 |
| Dec 2025 | $388,699 | $289,833 | $567,161 |
| Jan 2026 | $388,929 | $289,918 | $567,434 |
| Feb 2026 | $389,172 | $290,167 | $567,207 |
The pattern is clear. Prices slid gradually from March through October 2025 — a total drop of about $2,700. Then they reversed. November, December, January, and February each posted small gains.
The high end of the market barely moved all year, hovering in the $565K-$567K range. The low end saw a sharper relative swing, dropping from $292,634 to $289,833 before climbing back to $290,167.
Total range of movement over 12 months: $2,711 peak to trough. This is one of the flattest markets in California.
Is Bakersfield a Good Place to Buy in 2026?
The numbers paint a balanced picture.
Prices are essentially flat. You’re not overpaying in a frenzy, and you’re not catching a falling knife. The 0.5% annual decline barely qualifies as a price drop.
The rent-vs-buy gap is narrow enough that buying makes sense if you’re staying long-term. Population growth at 3.0% over four years adds a floor under demand.
Bakersfield remains one of the more affordable markets in California. The city median of $389,172 is a fraction of what you’d pay in Los Angeles or San Diego. For California buyers priced out of coastal markets, this is where the math starts working.
The risk? A flat market can stay flat. You probably won’t see rapid appreciation here. If you’re buying for quick equity gains, this isn’t the market for it. If you’re buying a home to live in, the stable prices mean less pressure to rush.
Bakersfield Housing Market Outlook for 2026-2027
The three-month trend through February 2026 shows prices ticking upward — small gains of $130-$250 per month. If that pace continues, the city median could reclaim $390,000 by mid-2026.
But the gains are so small that any shift in interest rates or local employment could flip the direction. The 12-month data shows this market moves in slow, shallow cycles rather than sharp swings.
The high end of the market has been remarkably stable, suggesting that upper-price neighborhoods face no selling pressure. The low end is more volatile in percentage terms, but the dollar amounts are still small.
Expect more of the same through 2027: flat to slightly positive, barring a shock to the broader economy.
Similar Markets in CA
If you’re shopping in Bakersfield, these California cities are worth comparing:
- Fresno — A Central Valley neighbor with a larger population and similar affordability profile.
- Riverside — Inland Empire pricing for buyers who need access to the greater LA job market.
- Fontana — Another inland option popular with commuters priced out of coastal cities.
- Long Beach — A step up in price, but coastal access and urban amenities come with it.
- Los Angeles — For perspective on just how much cheaper Bakersfield is versus LA proper.
Frequently Asked Questions
What is the average home price in Bakersfield?
The average home price in Bakersfield is $389,172 as of February 2026. Prices across the city’s nine tracked ZIP codes range from $290,167 in the 93304 area to $567,207 in 93314.
Are home prices going up or down in Bakersfield?
Home prices are down 0.5% year over year. However, that decline happened mostly between March and October 2025. Prices have posted four consecutive months of small gains since November.
Is it cheaper to rent or buy in Bakersfield?
Renting is cheaper on a monthly basis. The average rent across Bakersfield is about $1,851/month, while a mortgage on a median-priced home with 20% down runs roughly $2,071/month in principal and interest alone. Add taxes and insurance, and the gap widens further.
What is the most affordable neighborhood in Bakersfield?
ZIP code 93304 has the lowest median home value at $290,167 — about $99,000 below the city average. Rents there average $1,389/month. The neighboring 93301 area is the second most affordable at $310,273, with the city’s lowest rents at $1,295/month.
Methodology
Home values are based on the Zillow Home Value Index (ZHVI), a smoothed measure of typical home values in the 35th to 65th percentile range. Rent estimates use the Zillow Observed Rent Index (ZORI). Population figures come from the U.S. Census Bureau Population Estimates Program (2020-2024 vintage). All datasets are publicly available. Housing data updated 2026-02-28.