Riverside Home Prices: $637K, Down 1.3% — 7 ZIPs Analyzed (2026)
$637,401. That’s what a typical home costs in Riverside right now — and it’s actually less than it was a year ago.
The average home price in Riverside, CA fell 1.3% over the past twelve months. In a state where prices rarely move backward, that’s worth paying attention to. Here’s what the numbers say about where the market stands, which neighborhoods cost the most, and whether renting still beats buying.
Quick answer: The average home price in Riverside, CA is $637,401 as of February 2026, down 1.3% year over year according to Zillow.
Current Home Prices in Riverside
| Metric | Value |
|---|---|
| Median Home Value | $637,401 |
| Year-over-Year Change | -1.3% |
| Lowest ZIP Code Value | $556,234 |
| Highest ZIP Code Value | $751,458 |
| Number of ZIP Codes | 7 |
| Data as of | February 2026 |
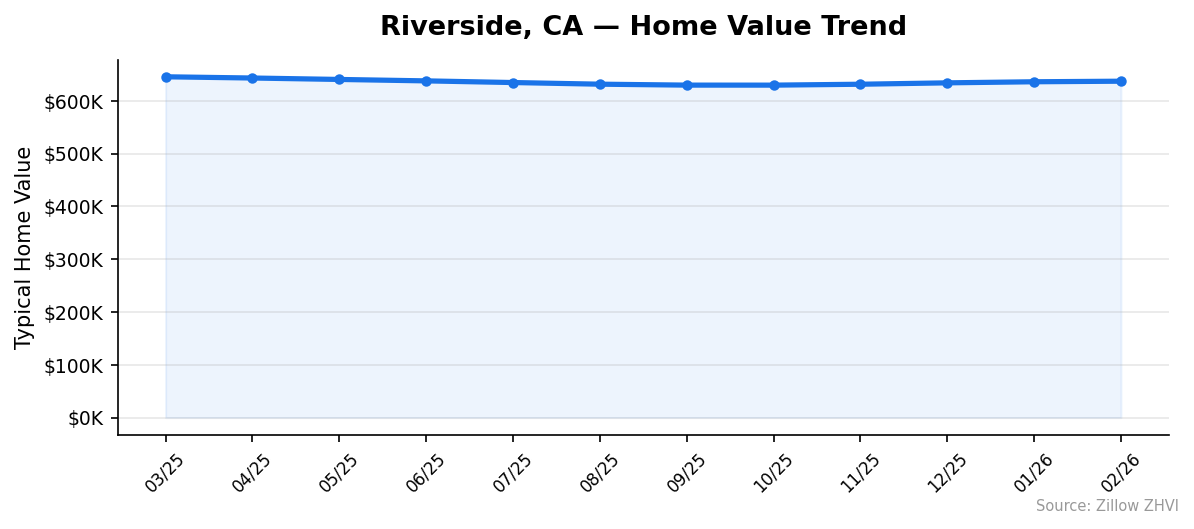
Riverside sits in the Riverside-San Bernardino-Ontario metro area, one of the largest housing markets in Southern California. The current median of $637,401 represents a pullback from the March 2025 peak of $645,768.
The price spread across the city is significant. A gap of nearly $195,000 separates the cheapest and most expensive ZIP codes. That range gives buyers real options depending on budget.
After declining through much of mid-2025, prices bottomed out around October at $629,945. Since then, the market has ticked upward for four straight months. The year-over-year figure is still negative, but the short-term direction has reversed.
For buyers, the 1.3% annual decline translates to roughly $8,400 less than this time last year. Not a dramatic discount, but a shift from the relentless appreciation California markets saw in prior years.
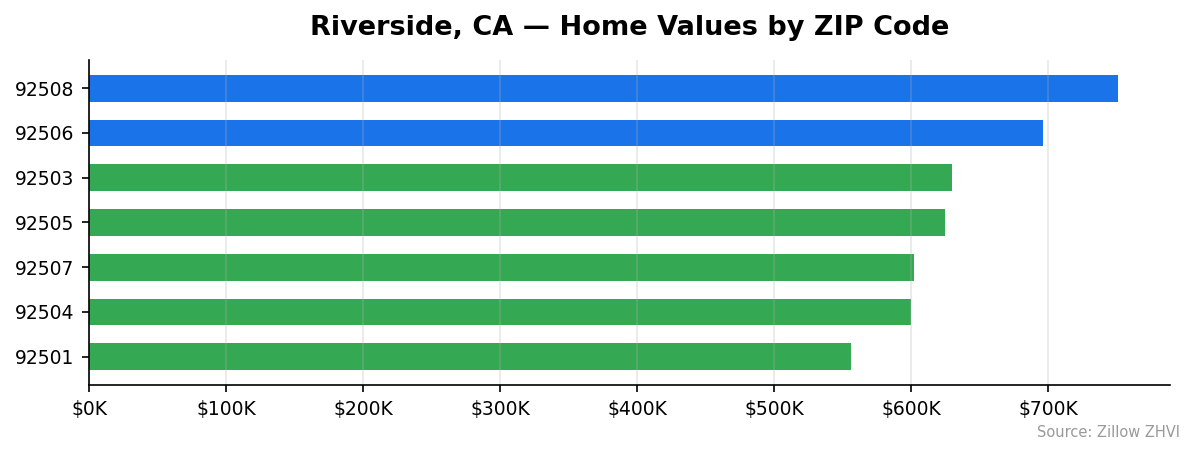
Riverside Home Prices by Neighborhood
| ZIP Code | Median Home Value | Average Rent |
|---|---|---|
| 92508 | $751,458 | $2,608/mo |
| 92506 | $696,085 | $2,805/mo |
| 92503 | $630,290 | $2,399/mo |
| 92505 | $624,997 | $2,337/mo |
| 92507 | $602,558 | $2,254/mo |
| 92504 | $600,186 | $2,409/mo |
| 92501 | $556,234 | $2,252/mo |
Most Expensive
92508 leads the city at $751,458 — roughly 18% above the city median — with rents averaging $2,608 per month. 92506 follows at $696,085 and actually commands the highest rents in the city at $2,805 per month, suggesting strong demand from both buyers and renters. 92503 rounds out the top three at $630,290, sitting close to the city-wide median.
Most Affordable
92501 is the most budget-friendly ZIP at $556,234, about 13% below the city average, with the lowest rents at $2,252 per month. 92504 comes in at $600,186 despite having relatively high rents of $2,409 — a disconnect that could signal rental demand outpacing home values. 92507 at $602,558 offers a middle ground with moderate rents of $2,254.
Rent vs Buy in Riverside
The city-wide average rent across all seven ZIP codes is approximately $2,438 per month.
| Scenario | Monthly Cost |
|---|---|
| Average Rent (all ZIPs) | ~$2,438 |
| Mortgage Payment (20% down, 7%, 30-yr) | ~$3,392 |
| Mortgage + Taxes/Insurance (est.) | ~$4,000+ |
On a median-priced home of $637,401 with 20% down ($127,480), you’d finance about $509,921. At a 7% rate over 30 years, the principal and interest payment alone runs roughly $3,392 per month. Add property taxes and insurance and you’re looking at $4,000 or more.
That’s a $1,500+ monthly gap between renting and owning. If you’re purely optimizing for cash flow, renting wins. But ownership builds equity, and with prices softening slightly, buyers who plan to stay five-plus years may find the math works in their favor.
One interesting detail: 92506 has the highest rents ($2,805) but only the second-highest home values. If you’re renting there, you’re paying a premium. Buying might close the gap faster than in other neighborhoods.
Population Growth and Migration
Riverside is gaining residents. The city grew from 315,534 people in 2020 to 323,757 in 2024 — a 2.6% increase over four years.
| Year | Population |
|---|---|
| 2020 | 315,534 |
| 2021 | 314,157 |
| 2022 | 320,339 |
| 2023 | 321,560 |
| 2024 | 323,757 |
The dip in 2021 (down to 314,157) aligns with pandemic-era migration patterns seen across California. Since then, the city has added roughly 9,600 residents in three years.
How does Riverside compare to other California cities?
| City | 2024 Population | 4-Year Growth |
|---|---|---|
| San Diego | 1,404,452 | 1.4% |
| Fresno | 550,105 | 1.4% |
| Sacramento | 535,798 | 1.9% |
| Oakland | 443,554 | 0.6% |
| Bakersfield | 417,468 | 3.0% |
| Riverside | 323,757 | 2.6% |
Riverside’s 2.6% growth rate outpaces San Diego, Fresno, Sacramento, and Oakland. Only Bakersfield grew faster at 3.0%. Continued population growth generally supports housing demand, which may put a floor under prices even as the market cools.
Riverside Housing Market Trends
Here’s how the average home price in Riverside moved month by month over the past year:
| Month | Average Value | Low | High |
|---|---|---|---|
| Mar 2025 | $645,768 | $567,417 | $759,568 |
| Apr 2025 | $643,441 | $565,966 | $757,376 |
| May 2025 | $640,732 | $564,832 | $754,320 |
| Jun 2025 | $638,019 | $562,887 | $751,843 |
| Jul 2025 | $634,867 | $559,399 | $748,738 |
| Aug 2025 | $631,756 | $555,368 | $745,660 |
| Sep 2025 | $629,985 | $552,697 | $743,348 |
| Oct 2025 | $629,945 | $551,791 | $743,053 |
| Nov 2025 | $631,659 | $552,469 | $745,001 |
| Dec 2025 | $634,291 | $554,247 | $748,128 |
| Jan 2026 | $636,343 | $555,615 | $750,573 |
| Feb 2026 | $637,401 | $556,234 | $751,458 |
The pattern is clear: prices declined steadily from March through October 2025, shedding about $15,800 (2.4%) over seven months. Then the trend reversed. From October’s low of $629,945 to February’s $637,401, the market recovered $7,456 — about half of the earlier decline.
The high-end of the market (max column) followed the same arc, dropping from $759,568 to $743,053 before climbing back to $751,458. Entry-level prices (min column) bottomed at $551,791 and have since recovered to $556,234.
Is Riverside a Good Place to Buy in 2026?
The data paints a balanced picture. Prices are down year over year, which favors buyers. But the four-month uptrend since October suggests the window for maximum discounts may be narrowing.
At $637,401, Riverside is expensive by national standards but remains more accessible than coastal California cities. The $556,234 entry point in 92501 puts homeownership within reach for buyers priced out of Los Angeles or San Diego.
Population growth of 2.6% supports long-term demand. The rental market is active — average rents above $2,400 mean landlords can generate income. For owner-occupants planning to stay at least five years, the slight price dip combined with steady population growth makes a reasonable case for buying.
The risk? If the year-over-year decline accelerates, buyers who purchased at the March 2025 peak are looking at a short-term loss. Timing matters less if you’re holding long-term.
Riverside Housing Market Outlook for 2026-2027
The three-month trend from December through February shows prices rising about $1,000 per month. If that pace continues through spring and summer — historically the strongest buying season — Riverside could reclaim the $640,000–$645,000 range by mid-2026.
The year-over-year gap is narrowing. In October 2025, the market was further below prior-year levels than it is now. The monthly recovery trend suggests the YoY figure could turn flat or slightly positive by late 2026.
Two factors to watch: mortgage rates and inventory. The data doesn’t include either, but both will determine whether the current uptrend has legs. What’s visible in the numbers is a market that corrected modestly and has started climbing again — not a crash, not a boom, but a slow grind upward.
Similar Markets in CA
If you’re shopping in Riverside, these nearby California markets are worth comparing:
- Los Angeles — The state’s largest market with a much higher price point, but more job options for commuters.
- Bakersfield — Significantly more affordable and growing faster (3.0%) than Riverside.
- San Diego — Coastal premium but only 1.4% population growth compared to Riverside’s 2.6%.
- Fresno — Central Valley pricing with a larger population base but slower growth.
- Fontana — A neighbor in the Inland Empire that often tracks closely with Riverside prices.
Frequently Asked Questions
What is the average home price in Riverside?
The average home price in Riverside, CA is $637,401 as of February 2026. This figure represents the typical home value across all seven ZIP codes, which range from $556,234 in 92501 to $751,458 in 92508.
Are home prices going up or down in Riverside?
Prices are down 1.3% year over year. However, the monthly trend has reversed — values have risen for four consecutive months since hitting a low of $629,945 in October 2025. The market appears to be in a recovery phase.
Is it cheaper to rent or buy in Riverside?
Renting is cheaper on a monthly basis. The average rent across Riverside is about $2,438 per month, while a mortgage on a median-priced home would cost roughly $3,400 in principal and interest alone (20% down, 7% rate). Adding taxes and insurance pushes the ownership cost above $4,000 per month.
What is the most affordable neighborhood in Riverside?
ZIP code 92501 has the lowest median home value at $556,234 — about $81,000 below the city-wide average. Rents there are also the lowest in the city at $2,252 per month. ZIP codes 92504 ($600,186) and 92507 ($602,558) are the next most affordable options.
Methodology
Home values are based on the Zillow Home Value Index (ZHVI), a smoothed measure of typical home values in the 35th to 65th percentile range. Rent estimates use the Zillow Observed Rent Index (ZORI). Population figures come from the U.S. Census Bureau Population Estimates Program (2020-2024 vintage). All datasets are publicly available. Housing data updated 2026-02-28.