Fontana Home Prices: $622K, Down 1.8% — 3 ZIPs Analyzed (2026)
$622,390. That’s what a typical home costs in Fontana right now — and it’s less than it was a year ago. Prices have slipped 1.8% over the past twelve months, marking a clear shift from the gains buyers saw through early 2025.
Quick answer: The average home price in Fontana, CA is $622,390 as of February 2026, down 1.8% year over year according to Zillow.
Current Home Prices in Fontana
Fontana sits in the Riverside-San Bernardino-Ontario metro area, one of Southern California’s more affordable corridors. Even so, the median home here tops $620,000.
| Metric | Value |
|---|---|
| Median Home Value | $622,390 |
| Year-over-Year Change | -1.8% |
| Lowest ZIP Median | $562,586 |
| Highest ZIP Median | $700,286 |
| Number of ZIP Codes | 3 |
| Data as of | February 2026 |
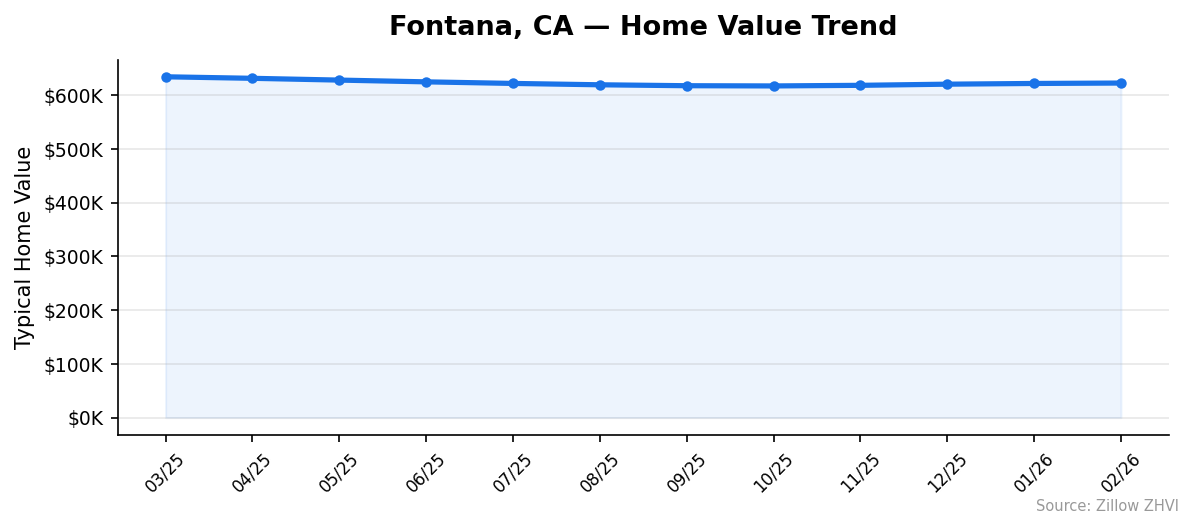
The 1.8% annual decline translates to roughly $11,600 lost in value over the past year. That reversal started after prices peaked near $634,000 in March 2025. Since then, the trend has been consistently downward, with only a slight pause in September-October 2025.
For buyers, this means a bit more breathing room. For sellers, it means pricing needs to reflect reality — not what the house next door sold for in spring 2025.
The gap between the cheapest and most expensive ZIP codes is $137,700. Where you buy within Fontana matters almost as much as when.
Fontana Home Prices by Neighborhood
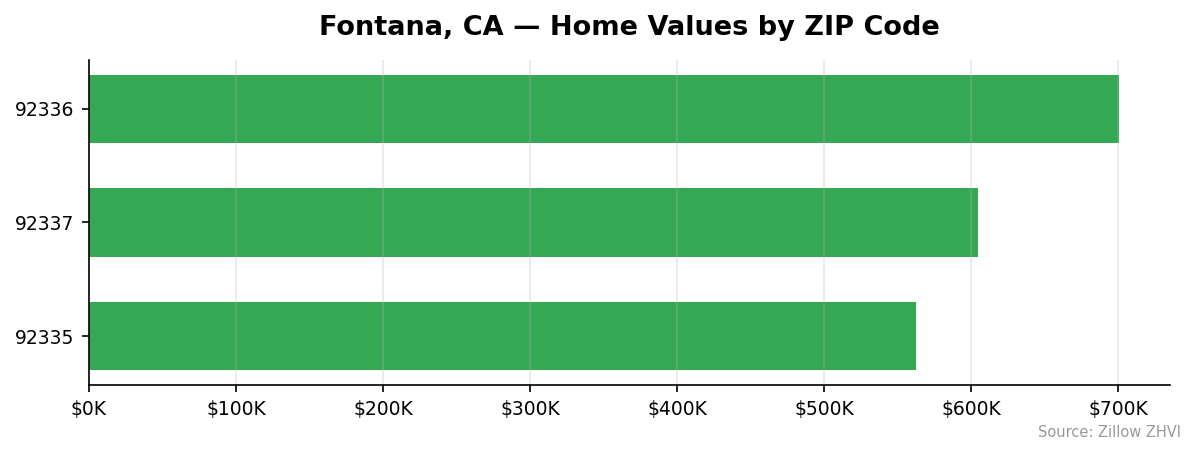
Fontana has three ZIP codes, and prices vary by nearly 25% from cheapest to most expensive.
| ZIP Code | Median Home Value | Average Rent |
|---|---|---|
| 92336 | $700,286 | $3,446/mo |
| 92337 | $604,297 | $3,229/mo |
| 92335 | $562,586 | $2,421/mo |
Most Expensive
92336 leads Fontana at $700,286 — about 12.5% above the city median, with rents to match at $3,446 per month.
Most Affordable
92335 comes in at $562,586, roughly $60,000 below the city average. Rent here is also the lowest at $2,421 per month, making it the most accessible entry point for both buyers and renters. 92337 sits in the middle at $604,297 with rents of $3,229.
Rent vs Buy in Fontana
The average rent across Fontana’s three ZIP codes works out to about $3,032 per month.
| ZIP Code | Monthly Rent | Monthly Mortgage (est.) |
|---|---|---|
| 92336 | $3,446 | ~$3,720 |
| 92335 | $2,421 | ~$2,990 |
| 92337 | $3,229 | ~$3,210 |
Mortgage estimates assume 20% down and a 7% interest rate, covering principal and interest only. Add property taxes, insurance, and maintenance, and the true cost of owning runs $500-$800 higher per month than the mortgage alone.
In 92337, renting and buying are nearly the same monthly cost. In 92335, renting saves you roughly $570 per month before you factor in ownership costs. In 92336, the gap is about $274 per month.
If you’re planning to stay five or more years, buying builds equity even in a flat market. But in a market that’s declining 1.8% annually, that equity gain shrinks. For short-term residents, renting makes more financial sense right now.
Population Growth and Migration
Fontana is one of the faster-growing cities in California. The population hit 218,455 in 2024, up 4.4% from 209,186 in 2020.
| Year | Population |
|---|---|
| 2020 | 209,186 |
| 2021 | 212,476 |
| 2022 | 214,577 |
| 2023 | 216,100 |
| 2024 | 218,455 |
That’s roughly 2,300 new residents per year — steady, consistent growth without the boom-bust pattern some Sun Belt cities show.
How does Fontana compare to other California cities?
| City | 2024 Population | 4-Year Growth |
|---|---|---|
| Fontana | 218,455 | 4.4% |
| Bakersfield | 417,468 | 3.0% |
| Sacramento | 535,798 | 1.9% |
| San Diego | 1,404,452 | 1.4% |
| Fresno | 550,105 | 1.4% |
| Oakland | 443,554 | 0.6% |
Fontana’s 4.4% growth rate outpaces every city on this list. More people means more housing demand. That population pressure is one reason prices haven’t fallen further despite the broader cooling trend.
Fontana Housing Market Trends
Here’s how prices moved month by month over the past year.
| Month | Average Value | Low (92335) | High (92336) |
|---|---|---|---|
| Mar 2025 | $634,032 | $571,135 | $713,799 |
| Apr 2025 | $631,192 | $568,539 | $711,170 |
| May 2025 | $627,879 | $566,033 | $707,507 |
| Jun 2025 | $624,610 | $563,620 | $703,670 |
| Jul 2025 | $621,679 | $561,161 | $700,235 |
| Aug 2025 | $619,146 | $559,022 | $697,111 |
| Sep 2025 | $617,424 | $557,586 | $695,166 |
| Oct 2025 | $617,015 | $557,368 | $694,581 |
| Nov 2025 | $618,147 | $558,400 | $695,931 |
| Dec 2025 | $620,288 | $560,330 | $698,197 |
| Jan 2026 | $621,615 | $561,482 | $699,673 |
| Feb 2026 | $622,390 | $562,586 | $700,286 |
The pattern tells a clear story. Prices fell steadily from March through October 2025 — a seven-month slide that shaved nearly $17,000 off the average home. Then the market found a floor. Since October, values have ticked up about $5,400 over four months.
The decline phase was faster than the recovery. Prices dropped $17,000 in seven months but only recovered $5,400 in four. The market is stabilizing, not rebounding.
Is Fontana a Good Place to Buy in 2026?
The numbers point to a market that favors patient buyers. Prices are down 1.8% year over year, and the recent four-month uptick is modest — less than 1%.
Fontana’s 4.4% population growth rate works in buyers’ favor long-term. More residents means sustained demand. The city is more affordable than coastal California by a wide margin, which keeps attracting families priced out of LA and Orange County.
The price gap between ZIP codes gives you options. If $700,000 is out of reach, 92335 gets you in the door at $562,586. That’s a $137,700 difference within the same city.
This isn’t a screaming deal, and it’s not a market in freefall. It’s a correction. If you’re buying to live in for five-plus years, the current dip works in your favor.
Fontana Housing Market Outlook for 2026-2027
The three-month trend from December 2025 through February 2026 shows slow, steady gains — about $700 per month. If that pace continues, Fontana’s median could reach the $625,000-$628,000 range by mid-2026.
But don’t expect a return to the March 2025 peak of $634,000 anytime soon. The recovery is too gradual for that. The market appears to be settling into a new range rather than racing back to previous highs.
Spring and summer typically bring more buyer activity, which could push prices slightly higher. The risk factor is mortgage rates — if rates climb further, that would dampen the recovery. Based on the data alone, expect sideways movement with a slight upward bias through late 2026.
Similar Markets in CA
If you’re considering Fontana, these California markets are worth comparing:
- Riverside — Fontana’s neighbor in the Inland Empire with a similar price profile
- Bakersfield — Significantly more affordable and also growing at 3.0% population growth
- Long Beach — Closer to the coast but at a higher price point
- Anaheim — Orange County option for buyers who want proximity to employment centers
- Fresno — Central Valley alternative with lower prices and 1.4% population growth
Frequently Asked Questions
What is the average home price in Fontana?
The average home price in Fontana is $622,390 as of February 2026. Prices range from $562,586 in ZIP code 92335 to $700,286 in 92336. The city-wide median is down 1.8% compared to the same time last year.
Are home prices going up or down in Fontana?
Prices are down 1.8% year over year. They fell from a peak of $634,032 in March 2025 to a low of $617,015 in October 2025, then partially recovered to $622,390 by February 2026. The overall direction over the past twelve months is down, though the most recent months show stabilization.
Is it cheaper to rent or buy in Fontana?
Renting is cheaper in most cases. The average rent across Fontana is about $3,032 per month. A mortgage on the median home at 7% with 20% down runs approximately $3,310 per month for principal and interest — and that’s before property taxes, insurance, and maintenance add another $500-$800.
What is the most affordable neighborhood in Fontana?
ZIP code 92335 is the most affordable, with a median home value of $562,586 — about $60,000 below the city average. Rent there averages $2,421 per month, also the lowest in the city. It’s the best entry point for budget-conscious buyers and renters.
Methodology
Home values are based on the Zillow Home Value Index (ZHVI), a smoothed measure of typical home values in the 35th to 65th percentile range. Rent estimates use the Zillow Observed Rent Index (ZORI). Population figures come from the U.S. Census Bureau Population Estimates Program (2020-2024 vintage). All datasets are publicly available. Housing data updated 2026-02-28.