Buffalo Home Prices: $249K, Up 3.1% — 25 ZIPs Analyzed (2026)
$249,081. That’s the typical home value in Buffalo as of February 2026, up 3.1% over the past year. Every month in the past 12 has been higher than the one before it.
Quick answer: The average home price in Buffalo, NY is $249,081 as of February 2026, up 3.1% year over year according to Zillow.
Current Home Prices in Buffalo
Buffalo is not a cheap market anymore — but it’s not expensive either. The $249K median puts it well below national numbers and far under anything near New York City. You also get a wide spread across the city, from entry-level East Side homes to West Side streets pushing above half a million.
| Metric | Value |
|---|---|
| Median home value | $249,081 |
| Year-over-year change | +3.1% |
| Cheapest ZIP | $109,535 (14211) |
| Most expensive ZIP | $555,009 (14202) |
| ZIPs analyzed | 25 |
| Data month | February 2026 |
| Metro area | Buffalo-Cheektowaga, NY |
The gap between the cheapest and most expensive ZIP is roughly 5x. That’s a wider spread than most midsize markets show. What you pay in Buffalo depends almost entirely on which side of Main Street you’re looking at.
Year-over-year growth of 3.1% is steady, not hot. It tracks closer to wage growth than to the double-digit runs some southern metros saw earlier this decade. For a buyer, that means prices are rising but not sprinting away from you.
Buffalo Home Prices by Neighborhood
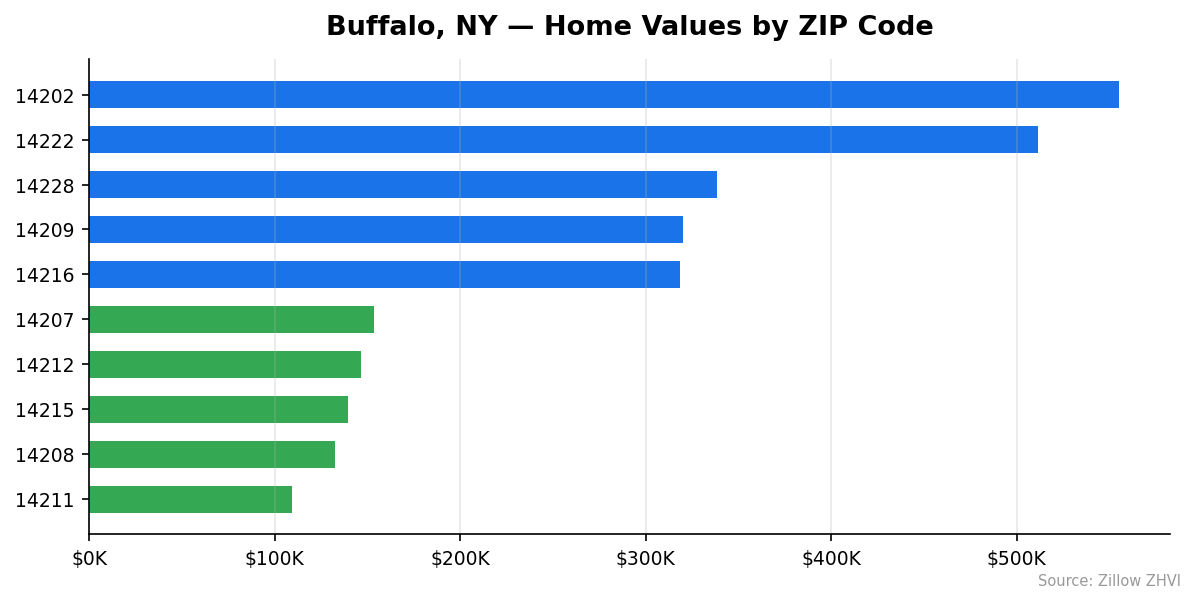
Here’s every ZIP code in Buffalo, sorted from most to least expensive.
| ZIP | Typical Home Value | Typical Rent |
|---|---|---|
| 14202 | $555,009 | — |
| 14222 | $511,809 | $1,554 |
| 14228 | $338,715 | $1,787 |
| 14209 | $320,259 | $1,499 |
| 14216 | $318,453 | $1,432 |
| 14226 | $301,090 | $1,847 |
| 14201 | $297,427 | $1,228 |
| 14224 | $281,673 | — |
| 14214 | $273,755 | $1,561 |
| 14223 | $255,842 | $1,338 |
| 14227 | $253,458 | $1,218 |
| 14217 | $247,170 | $1,322 |
| 14219 | $245,307 | — |
| 14225 | $220,424 | — |
| 14220 | $220,100 | $1,284 |
| 14218 | $205,162 | $1,242 |
| 14213 | $190,028 | $1,344 |
| 14204 | $173,711 | $1,641 |
| 14210 | $169,990 | $1,300 |
| 14206 | $165,989 | $1,125 |
| 14207 | $153,374 | $1,220 |
| 14212 | $146,519 | — |
| 14215 | $139,612 | $1,193 |
| 14208 | $132,624 | — |
| 14211 | $109,535 | — |
Most Expensive
14202 ($555,009) covers downtown and the waterfront, where new construction and converted loft buildings push values more than twice the city median. 14222 ($511,809) is Elmwood Village, the walkable corridor that commands the highest prices for traditional single-family homes. 14228 ($338,715) sits in the Amherst suburbs — not technically Buffalo proper but included in the metro footprint, with rents topping $1,787 a month.
Most Affordable
14211 ($109,535) on the East Side is the cheapest ZIP by a wide margin — you can still buy there for less than the down payment on a home in Elmwood. 14208 ($132,624) is also East Side, about 47% below the city average. 14215 ($139,612) covers parts of the University District and Kensington, where rents average $1,193 a month — attractive for investors working the buy-and-hold math.
Rent vs Buy in Buffalo
Across the 18 Buffalo ZIPs with rent data, typical monthly rent lands near $1,370. The range runs from $1,125 in 14206 to $1,847 in 14226.
Now the buy side. On the $249,081 median with 20% down and a 7% 30-year mortgage, principal and interest work out to roughly $1,325 a month. Add property taxes — New York’s effective rate in Erie County runs around 2.4%, or about $498 a month — plus $100 for homeowners insurance. That puts the total monthly cost around $1,923 before maintenance.
| Housing option | Typical monthly cost |
|---|---|
| Rent (citywide average) | ~$1,370 |
| Buy (PITI on median home, 20% down) | ~$1,923 |
| Buy with 10% down | ~$2,100 |
Renting costs about $550 less per month than owning at the median. The math gets friendlier for buyers in the cheaper ZIPs. A $139,612 home in 14215 with 20% down runs about $1,200 a month all-in — below the typical rent in that same ZIP.
Property taxes are what flip the equation against buyers here. Take them out and Buffalo is one of the better rent-vs-buy cases in the country. Leave them in and you need to plan to stay five years or more for ownership to pencil out.
Population Growth and Migration
Buffalo has 276,617 residents as of 2024. That’s 941 fewer people than in 2020 — a drop of 0.3% over four years.
| Year | Population |
|---|---|
| 2020 | 277,558 |
| 2021 | 277,728 |
| 2022 | 275,907 |
| 2023 | 276,376 |
| 2024 | 276,617 |
The city bottomed in 2022 and has added residents every year since. But it’s not back to 2020 levels yet. Call it flat, with a slight recovery trend.
Compare that to other New York cities:
| City | 2024 Population | 4-year growth |
|---|---|---|
| New Rochelle | 85,512 | +6.6% |
| White Plains | 62,561 | +5.0% |
| Albany | 101,317 | +2.7% |
| Schenectady | 69,495 | +1.7% |
| Yonkers | 211,040 | 0.0% |
| Buffalo | 276,617 | -0.3% |
The downstate cities near New York City are growing fastest. Upstate is slower. Buffalo is the only one on this list that lost population. For housing demand, that matters: a city losing residents while prices rise 3.1% suggests the gains are driven by tight supply, not new people moving in.
Buffalo Housing Market Trends
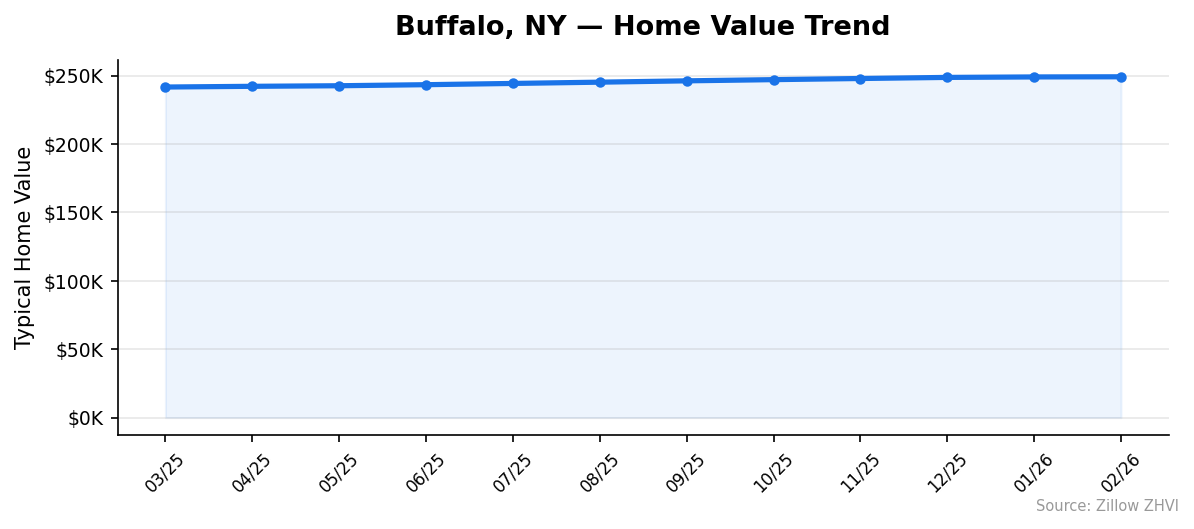
Twelve months of steady climb. No dips, no flat months.
| Month | Median Value |
|---|---|
| February 2026 | $249,081 |
| January 2026 | $248,972 |
| December 2025 | $248,630 |
| November 2025 | $247,823 |
| October 2025 | $246,995 |
| September 2025 | $246,119 |
| August 2025 | $245,147 |
| July 2025 | $244,222 |
| June 2025 | $243,306 |
| May 2025 | $242,535 |
| April 2025 | $242,122 |
| March 2025 | $241,596 |
Prices went from $241,596 to $249,081 over 12 months — a $7,485 gain, or 3.1%. The pace is tight: roughly $625 per month, month after month. Nothing about this chart looks dramatic.
The last three months alone added $1,258 in value. That’s a slower pace than earlier in the year. Momentum is there but softening.
Is Buffalo a Good Place to Buy in 2026?
The case for buying in Buffalo depends on what you’re after.
If you want price stability, the data argues yes. Twelve straight monthly gains at a modest 3.1% annual pace is about as boring as housing data gets. You’re not catching a falling knife here.
If you want appreciation, you’re looking at a slow market. 3.1% barely beats inflation. Better markets for price gains exist, especially in the South and Mountain West.
If you want affordability, Buffalo works. The $249K median is among the lowest for any major US city. Entry-level ZIPs like 14211 and 14208 still put a home under $140K — almost unheard of elsewhere.
Population is the weak spot. The city is shrinking, not growing. That limits how far prices can run without outside demand. Investors should weigh tax costs carefully — Erie County’s effective property tax rate pushes carrying costs higher than cheaper ZIPs might suggest on the listing price alone.
Buffalo Housing Market Outlook for 2026-2027
The 3-month trend suggests prices will keep grinding up through 2026, but at a slower clip than earlier in 2025. The pace slowed from $800+ per month in mid-2025 to around $400 per month in the last three months of data.
If the current pace continues, the median could approach $251,000 to $253,000 by mid-2026. That would be another 1-2% gain over where things stand now. No signal in the data points to a decline.
The risk is on the demand side. Population losses and rising interest rates could cap how far prices climb. If rent levels stay flat while values keep rising, the rent-to-price ratio gets worse for investors, which tends to cool buying activity.
Similar Markets in NY
- Rochester — Closest comparable to Buffalo, another upstate market with similar affordability and population profile.
- Syracuse — Another upstate city where you can still find homes under $200K.
- Albany — State capital market with modest growth, midway in price between Buffalo and downstate.
- Schenectady — Smaller capital-region city with similar entry-level pricing.
- New York — The opposite end of the state market; worth comparing to see how much further your dollar goes in Buffalo.
Buffalo buyers looking for a bigger city feel at similar prices might consider Rochester. Those open to downstate tradeoffs can check Albany.
Frequently Asked Questions
What is the average home price in Buffalo?
The average home price in Buffalo, NY is $249,081 as of February 2026. That figure is the Zillow Home Value Index across 25 ZIP codes in the city, covering typical single-family and condo values in the 35th to 65th percentile range.
Are home prices going up or down in Buffalo?
Up. Buffalo home values rose 3.1% over the last 12 months, from $241,596 in March 2025 to $249,081 in February 2026. Every single month in that window posted a month-over-month gain — no pullbacks.
Is it cheaper to rent or buy in Buffalo?
Renting wins on monthly cost. Typical rent across Buffalo ZIPs is about $1,370 a month, versus an estimated $1,923 all-in to own the median home with 20% down. In cheaper ZIPs like 14215, owning can actually beat renting.
What is the most affordable neighborhood in Buffalo?
ZIP 14211 on the East Side, with typical values around $109,535. That’s less than half the city median and the lowest-priced ZIP in the entire 25-ZIP dataset. ZIP 14208 at $132,624 is the next cheapest.
Methodology
Home values are based on the Zillow Home Value Index (ZHVI), a smoothed measure of typical home values in the 35th to 65th percentile range. Rent estimates use the Zillow Observed Rent Index (ZORI). Population figures come from the U.S. Census Bureau Population Estimates Program (2020-2024 vintage). All datasets are publicly available. Housing data updated 2026-02-28.