Rochester Home Prices: $222K, Up 2.6% — 21 ZIPs Analyzed (2026)
$221,968. That’s the typical home price in Rochester right now, and it’s up 2.6% from a year ago. Twelve straight monthly readings show the same pattern: a slow, steady climb rather than a spike.
Quick answer: The average home price in Rochester, NY is $221,968 as of February 2026, up 2.6% year over year according to Zillow.
Current Home Prices in Rochester
The headline number is $221,968. That puts Rochester far below the national median and well below most of New York State’s downstate metros.
Here’s the snapshot for February 2026:
| Metric | Value |
|---|---|
| Median home value | $221,968 |
| Year-over-year change | +2.6% |
| Cheapest ZIP | $91,211 (14605) |
| Most expensive ZIP | $384,065 (14618) |
| ZIP codes tracked | 21 |
| Spread (max ÷ min) | 4.2x |
The spread is the part worth pausing on. The most expensive ZIP costs more than four times the cheapest. Few mid-sized US cities have that kind of internal price gap. It means “Rochester home prices” depends almost entirely on which side of the city you’re talking about.
The 2.6% annual gain is modest. National home prices moved in a similar range over the same period, so Rochester is tracking the country rather than leading or lagging it. What’s notable is consistency — every month in the trend table shows a higher value than the one before it.
You won’t find a $221,968 house in the wealthier ZIPs. You also won’t find a $384,000 house in the cheapest ones. The median is a city-wide average; the actual price you’ll pay depends on the neighborhood, and the neighborhood data tells a sharper story than the headline.
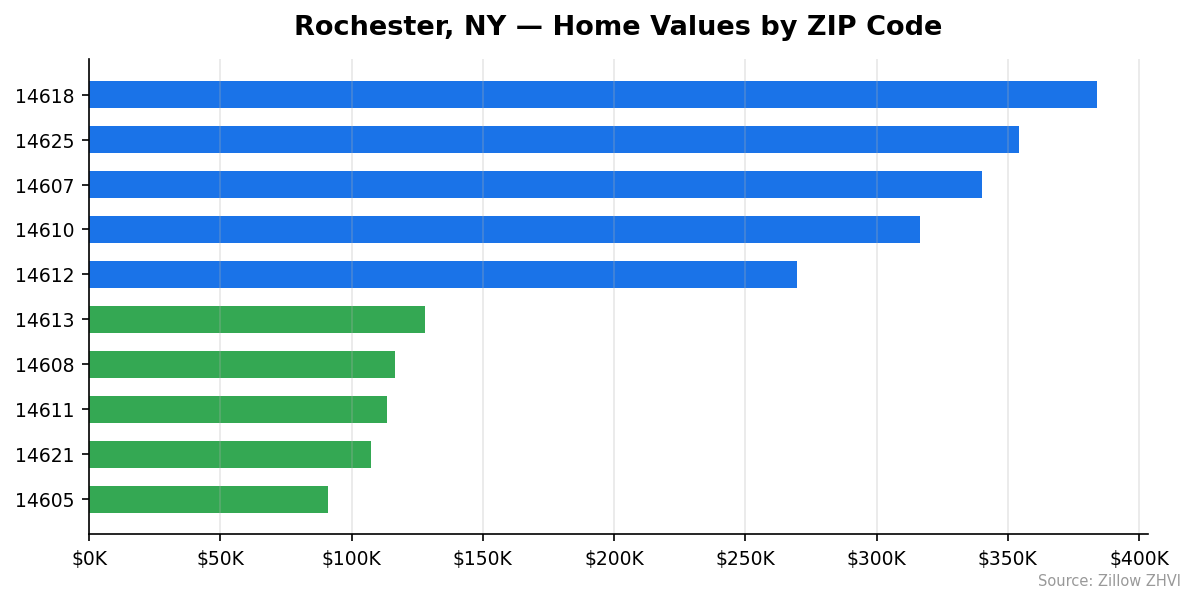
Rochester Home Prices by Neighborhood
Twenty-one ZIP codes, sorted from most to least expensive:
| ZIP | Home Value | Typical Rent |
|---|---|---|
| 14618 | $384,065 | Data not available |
| 14625 | $354,287 | Data not available |
| 14607 | $340,326 | $1,383 |
| 14610 | $316,555 | $1,841 |
| 14612 | $269,879 | $1,308 |
| 14626 | $269,181 | $1,489 |
| 14620 | $263,518 | $1,609 |
| 14624 | $256,002 | $1,706 |
| 14617 | $248,439 | $1,716 |
| 14623 | $245,590 | $2,121 |
| 14622 | $224,426 | Data not available |
| 14616 | $202,109 | $1,462 |
| 14606 | $199,746 | $1,296 |
| 14609 | $194,515 | $1,432 |
| 14615 | $179,027 | $1,285 |
| 14619 | $157,271 | Data not available |
| 14613 | $127,856 | $1,195 |
| 14608 | $116,574 | $1,309 |
| 14611 | $113,525 | $1,260 |
| 14621 | $107,222 | $1,361 |
| 14605 | $91,211 | Data not available |
Most Expensive
14618 — $384,065. This is the priciest ZIP in the city, 73% above the Rochester median. It’s the only ZIP where the typical home crosses into upper-bracket territory.
14625 — $354,287. Close behind, with values 60% above the median. Rent data isn’t reported here, which often signals an owner-occupied area with limited rental supply.
14607 — $340,326. The third most expensive ZIP, but its rent of $1,383 is the lowest among the top tier — pointing to a mix of high-value owned homes and older rental stock.
Most Affordable
14605 — $91,211. The cheapest ZIP, at 59% below the city median. A buyer with $20,000 in cash could put 20% down here and still have closing costs left over.
14621 — $107,222. Slightly higher, but still a fraction of the city average. Rent of $1,361 means a mortgage payment would likely undercut the rent here.
14611 — $113,525. Rounds out the bottom three. Like 14621, it’s a ZIP where the math favors buying for anyone who can clear the down payment hurdle.
Rent vs Buy in Rochester
Rent data exists for 16 of the 21 ZIPs. The range runs from $1,195 in 14613 to $2,121 in 14623. Most ZIPs cluster between $1,300 and $1,750.
Here’s the buy-side math at the city median. With 20% down on a $221,968 home, the loan is $177,574. At a 7% mortgage rate, principal and interest run roughly $1,180 a month. New York property taxes are heavy — Monroe County effective rates often exceed 2.5% — so add another $460 per month. Insurance pushes the total to about $1,680.
That’s the mortgage payment a typical Rochester buyer faces. Compare it to the rents:
| ZIP | Home Value | Mortgage Est. | Typical Rent | Cheaper To |
|---|---|---|---|---|
| 14605 | $91,211 | ~$700 | n/a | Buy |
| 14613 | $127,856 | ~$960 | $1,195 | Buy |
| 14611 | $113,525 | ~$860 | $1,260 | Buy |
| 14609 | $194,515 | ~$1,460 | $1,432 | Rent (barely) |
| 14618 | $384,065 | ~$2,890 | n/a | Rent |
In the cheaper ZIPs, buying wins by hundreds of dollars a month — assuming you can save the down payment. In the expensive ZIPs, renting is dramatically cheaper. The crossover sits near $200,000, which lines up with where the city splits in half by ZIP count.
The catch with the buy-side math: it doesn’t include maintenance, vacancies between repairs, or closing costs. Add those in and the rent-vs-buy line moves up, favoring renting more than the raw payment numbers suggest.
Population Growth and Migration
Rochester is losing residents. The city had 210,892 people in 2020 and 207,282 in 2024 — a 1.7% drop over four years.
| Year | Population |
|---|---|
| 2020 | 210,892 |
| 2021 | 210,285 |
| 2022 | 208,203 |
| 2023 | 207,235 |
| 2024 | 207,282 |
The decline isn’t accelerating. Population stabilized between 2023 and 2024, with a small uptick of 47 residents. But the four-year trajectory is still down.
Compare that to other NY cities:
| City | 2024 Population | 4-yr Growth |
|---|---|---|
| New Rochelle | 85,512 | +6.6% |
| White Plains | 62,561 | +5.0% |
| Albany | 101,317 | +2.7% |
| Schenectady | 69,495 | +1.7% |
| Yonkers | 211,040 | 0.0% |
| Rochester | 207,282 | -1.7% |
Every comparable upstate city outgrew Rochester. New Rochelle and White Plains, both downstate suburbs of New York City, gained at five times the rate of an Albany or Schenectady. Rochester is the only city on the list that shrank.
What this means for housing: a flat or shrinking population usually caps how fast prices can rise. Rochester’s 2.6% annual gain is happening despite — not because of — population growth. It’s coming from low inventory and the affordability gap with downstate New York, not from people moving in.
Rochester Housing Market Trends
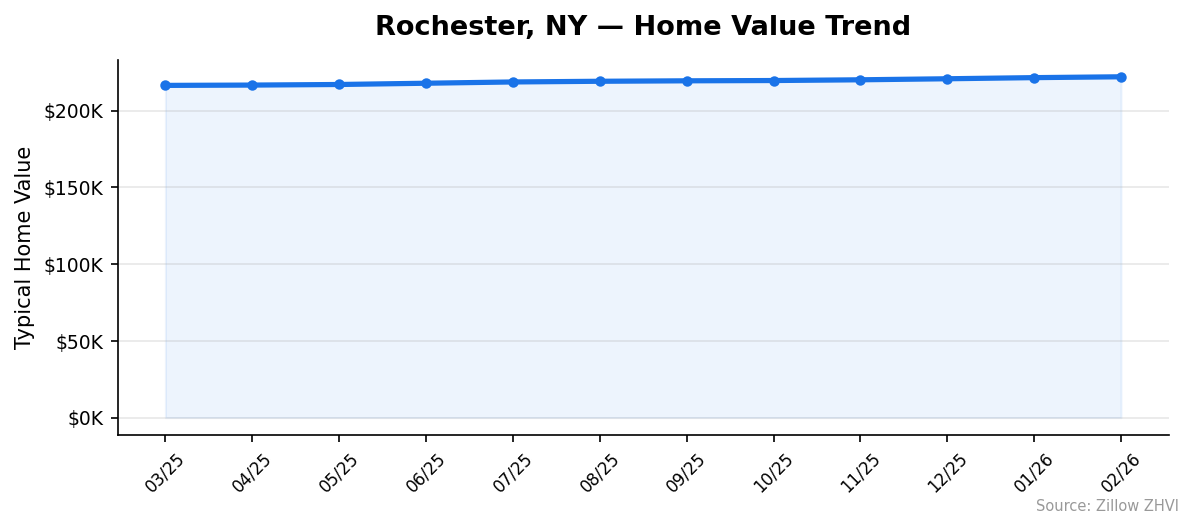
Twelve months of values, oldest first:
| Month | Median Value |
|---|---|
| 2025-03 | $216,362 |
| 2025-04 | $216,569 |
| 2025-05 | $216,952 |
| 2025-06 | $217,770 |
| 2025-07 | $218,602 |
| 2025-08 | $219,049 |
| 2025-09 | $219,348 |
| 2025-10 | $219,532 |
| 2025-11 | $220,008 |
| 2025-12 | $220,683 |
| 2026-01 | $221,419 |
| 2026-02 | $221,968 |
Every single month is higher than the one before. No flat months, no dips. That’s unusual — most metros have at least one seasonal pause.
The pace varies though. Spring 2025 was slow: April-to-May gained $383. Summer accelerated: June-to-July added $832. The last three months show $675-$700 monthly gains, which is roughly a 3.7% annualized pace. So the year-over-year number understates current momentum.
The high-end ZIPs gained more dollars in absolute terms. The max ZIP value rose from $370,425 to $384,065 — a $13,640 jump. The cheapest ZIP value actually fell, from $93,771 to $91,211. The gap between the most and least expensive areas widened by roughly $16,000 over the year.
Is Rochester a Good Place to Buy in 2026?
For a buyer who needs affordability, yes. For a buyer betting on appreciation, the answer is more cautious.
The case for buying: Rochester is one of the cheapest mid-sized cities in the Northeast. At $221,968, the median home costs less than half of Albany’s typical price and a fraction of any downstate market. The buy-vs-rent math favors buying in roughly two-thirds of the ZIPs. And the 12-month price chart shows steady, predictable gains — not the kind of volatility that punishes buyers who time it wrong.
The case against: population is shrinking, which limits long-term demand. The 2.6% annual gain barely outpaces inflation. New York property taxes are punishing — they’ll add 2-3% of the home’s value to your annual cost, which is a meaningful headwind on price appreciation.
A buyer planning to stay 5+ years and prioritizing payment-vs-rent math will probably do well here. A speculator hoping for double-digit appreciation should look elsewhere.
Rochester Housing Market Outlook for 2026-2027
The 3-month trend shows a $675-$750 monthly increase, which annualizes to roughly $8,000-$9,000 over a year. If that pace continues, the median would reach somewhere near $230,000 by February 2027.
That’s a big “if.” The pace has been remarkably stable for 12 months, but stability isn’t a forecast. A spike in mortgage rates would slow the climb. A drop in rates could accelerate it, especially in the lower-priced ZIPs where buying already beats renting on a payment basis.
The widening gap between expensive and cheap ZIPs is worth watching. If 14605 keeps falling while 14618 keeps climbing, the city will look more bifurcated by 2027 — and the median number will hide more than it reveals.
Similar Markets in NY
- Buffalo — Western New York’s other major city, often used as a direct comp for Rochester.
- Syracuse — Similar size, similar upstate dynamics, similar affordability profile.
- Albany — Smaller but growing, and a useful benchmark for what stable population can do to prices.
- Schenectady — Another upstate city worth comparing for buyers weighing the Capital Region.
- Binghamton — Even more affordable than Rochester for buyers willing to go further south.
Frequently Asked Questions
What is the average home price in Rochester?
The average home price in Rochester, NY is $221,968 as of February 2026. That covers 21 ZIP codes ranging from $91,211 in 14605 to $384,065 in 14618. The city median sits well below the New York State average and roughly half the national figure.
Are home prices going up or down in Rochester?
Up. Prices climbed 2.6% over the past 12 months, rising from $216,362 in March 2025 to $221,968 in February 2026. The trend has been unusually steady — every month in the past year posted a higher value than the one before.
Is it cheaper to rent or buy in Rochester?
It depends on the ZIP. In the cheaper neighborhoods, mortgage payments come in well below typical rents — buying wins by $200-$400 a month. In the expensive ZIPs like 14618, renting is dramatically cheaper. The crossover point sits around $200,000 in home value.
What is the most affordable neighborhood in Rochester?
ZIP 14605 is the cheapest, with a typical home value of $91,211 — 59% below the city median. The next two most affordable ZIPs are 14621 at $107,222 and 14611 at $113,525. All three sit on the lower end of the city’s price range.
Methodology
Home values are based on the Zillow Home Value Index (ZHVI), a smoothed measure of typical home values in the 35th to 65th percentile range. Rent estimates use the Zillow Observed Rent Index (ZORI). Population figures come from the U.S. Census Bureau Population Estimates Program (2020-2024 vintage). All datasets are publicly available. Housing data updated 2026-02-28.