Mount Vernon Home Prices: $563K, Up 2.3% — 3 ZIPs Analyzed (2026)
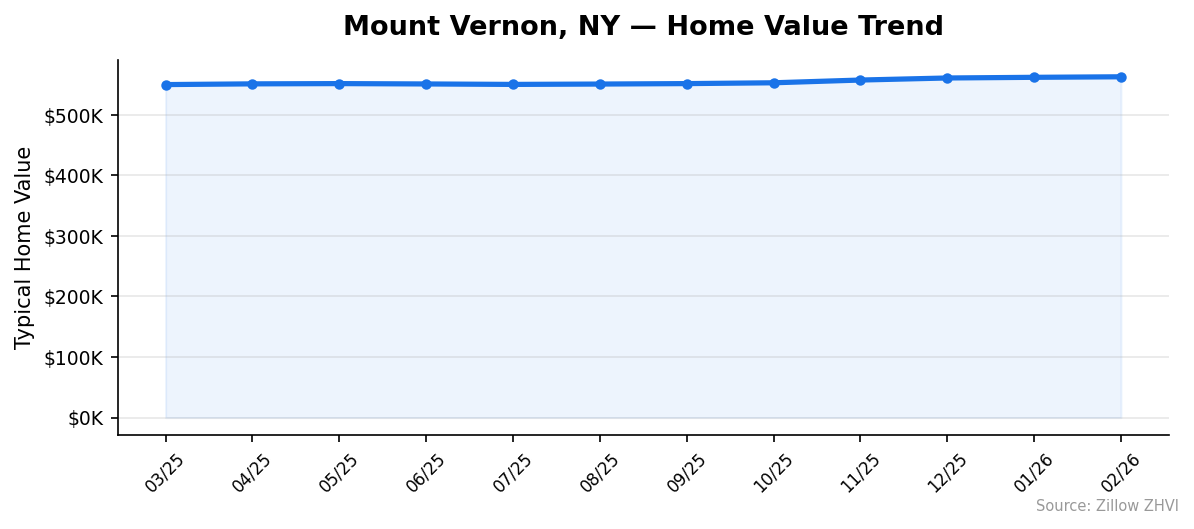
$562,874. That is what a typical home costs in Mount Vernon as of February 2026. Prices are up 2.3% from a year ago, and they have climbed every single month since last summer.
Quick answer: The average home price in Mount Vernon, NY is $562,874 as of February 2026, up 2.3% year over year according to Zillow.
Current Home Prices in Mount Vernon
The typical Mount Vernon home costs more than half a million dollars. That puts the city well above the national median, which is expected for a Westchester County address 30 minutes from Grand Central.
| Metric | Value |
|---|---|
| Median home value | $562,874 |
| Year-over-year change | +2.3% |
| Cheapest ZIP | $547,980 |
| Most expensive ZIP | $580,144 |
| Spread between ZIPs | $32,164 |
| Metro area | New York-Newark-Jersey City |
| Data through | February 2026 |
The gap between the cheapest and priciest ZIP is about $32,000. That is a small range compared with most cities. In Mount Vernon, you do not save much by switching neighborhoods.
The 2.3% annual gain is modest. It tracks below the broader national rebound in home prices, but it reverses the flat stretch the city went through in mid-2025. The lowest reading in the past 12 months came in July 2025, when the average sat at $550,288. Values have climbed each month since.
You are paying a Westchester premium for proximity to Manhattan. The Metro-North Harlem and New Haven lines both serve the area, and that train access shows up in every ZIP code price.
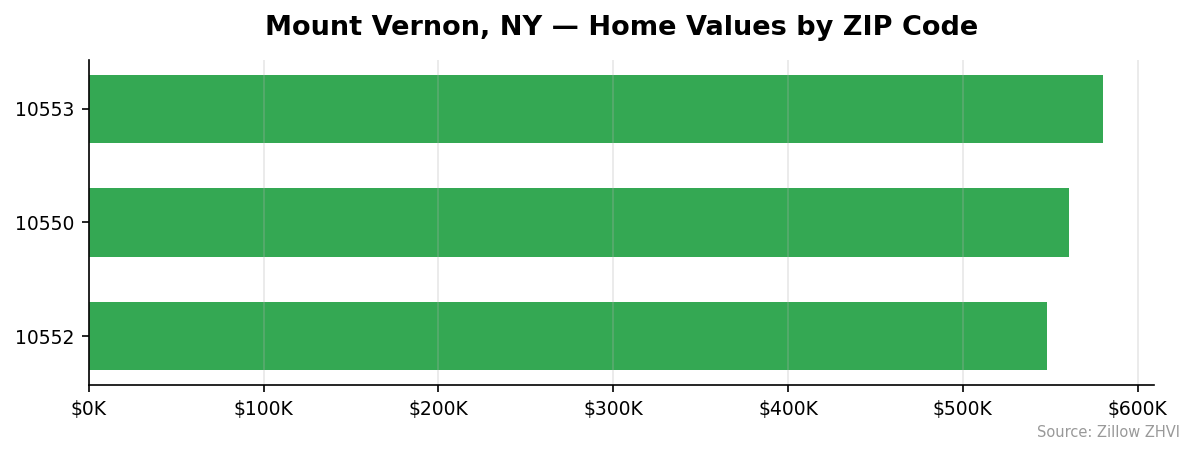
Mount Vernon Home Prices by Neighborhood
Three ZIP codes cover the city. Here is what each one looks like.
| ZIP Code | Median Value | Median Rent | vs City Avg |
|---|---|---|---|
| 10553 | $580,144 | Not available | +$17,270 |
| 10550 | $560,499 | $2,772 | -$2,375 |
| 10552 | $547,980 | $2,712 | -$14,894 |
Most Expensive
- 10553 at $580,144 sits at the top of the list, running about $17,000 above the citywide average. Rent figures are not yet tracked for this ZIP.
Most Affordable
- 10552 at $547,980 is the cheapest of the three, with rent around $2,712 a month — the lowest in the city.
- 10550 at $560,499 lands almost exactly on the city median, with rent at $2,772.
With only three ZIPs and a $32,000 spread, the neighborhood-shopping strategy that works in larger cities does not deliver much here. The biggest discount you can find is roughly 6% below the priciest area.
Rent vs Buy in Mount Vernon
Renting wins the monthly math in Mount Vernon by a wide margin.
The average rent across the two ZIPs with data is about $2,742 a month. A mortgage on the $562,874 median home, assuming 20% down at 7% interest on a 30-year loan, runs roughly $2,996 a month for principal and interest alone.
| Cost | Monthly |
|---|---|
| Average rent | $2,742 |
| Mortgage P&I (20% down, 7%) | $2,996 |
| Estimated property tax | $708 |
| Estimated insurance | $150 |
| Total ownership cost | $3,854 |
| Monthly gap | $1,112 |
Westchester County carries some of the highest property tax rates in the country. A median Mount Vernon home generates an estimated $8,500 in annual taxes, which adds roughly $708 to the monthly cost. Add insurance and the total ownership burden climbs to about $3,854 per month.
That makes renting cheaper by more than $1,100 a month. Buyers get equity in return for paying more, but the breakeven point requires staying put for several years and counting on continued price appreciation.
Population Growth and Migration
Mount Vernon is losing residents. The Census Bureau estimates the population at 71,999 in 2024, down from 73,561 in 2020 — a 2.1% decline over four years.
| Year | Population |
|---|---|
| 2020 | 73,561 |
| 2021 | 72,866 |
| 2022 | 71,956 |
| 2023 | 71,618 |
| 2024 | 71,999 |
The 2024 figure shows a slight rebound from 2023, but the city has not returned to its 2020 level. Compare that to neighboring Westchester cities:
| City | 2024 Population | 4-Year Change |
|---|---|---|
| Yonkers | 211,040 | 0.0% |
| New Rochelle | 85,512 | +6.6% |
| White Plains | 62,561 | +5.0% |
| Albany | 101,317 | +2.7% |
| Schenectady | 69,495 | +1.7% |
| Mount Vernon | 71,999 | -2.1% |
New Rochelle, just to the east, gained 6.6% in the same period. White Plains added 5%. Mount Vernon is the outlier on the wrong side.
Shrinking population usually means softening demand. The fact that Mount Vernon prices kept climbing anyway suggests the buyers who do show up are paying for a fixed supply of homes near a Manhattan-bound train.
Mount Vernon Housing Market Trends
Prices have moved in one direction for nine straight months.
| Month | Median Value |
|---|---|
| Feb 2026 | $562,874 |
| Jan 2026 | $562,004 |
| Dec 2025 | $560,896 |
| Nov 2025 | $557,498 |
| Oct 2025 | $552,965 |
| Sep 2025 | $551,617 |
| Aug 2025 | $550,882 |
| Jul 2025 | $550,288 |
| Jun 2025 | $551,038 |
| May 2025 | $551,616 |
| Apr 2025 | $551,195 |
| Mar 2025 | $550,005 |
The first half of 2025 was nearly flat. From March through July, the median bounced between $550,000 and $551,600 — a range of just $1,300 across five months. Then the climb started.
Since July, the city has added $12,586 in median value. That works out to about $1,800 a month, or roughly 2.3% annualized when you stretch the recent pace forward. The maximum-priced ZIP also hit a new high in February 2026 at $580,144, surpassing the previous peak from December.
The trend is consistent. There are no monthly drops in the recent stretch.
Is Mount Vernon a Good Place to Buy in 2026?
The data points in mixed directions.
In the buyer’s column: prices have only risen 2.3% annually, the population is shrinking, and renting beats owning by more than $1,100 a month on the typical home. None of those say “rush to buy.”
In the seller’s column: prices have not dropped in nine months, the climb is steady rather than spiky, and the spread between ZIPs is tight enough that there are no obvious bargain pockets. Inventory pressure from neighboring growing cities like New Rochelle and White Plains keeps the broader Westchester market firm.
For a long-term resident who plans to stay 7 to 10 years and values the Metro-North access, the math eventually works in favor of buying. For someone with a shorter horizon, the monthly cost gap means renting frees up real cash. The current market is neither a clear buy nor a clear sell — it is a slow grind upward.
Mount Vernon Housing Market Outlook for 2026-2027
The 3-month trend points up. From November 2025 to February 2026, median values rose from $557,498 to $562,874 — an increase of $5,376, or about 1% per quarter.
If the current pace continues, the median should test $570,000 by mid-2026. The 12-month trajectory has been flat-to-rising with no monthly declines since the summer of 2025, which suggests the floor has held.
The shrinking population is a longer-term drag that has not yet shown up in price data. Watch for whether the recent population uptick from 71,618 in 2023 to 71,999 in 2024 holds. If outmigration resumes, the upward price trend could stall, especially in the cheaper ZIPs where the rent-versus-buy math already favors renters.
The most expensive ZIP (10553) is leading the climb. If that gap widens further, expect more buyers to settle for 10550 or 10552.
Similar Markets in NY
Mount Vernon buyers priced out of the local market often look elsewhere in New York for better value or different city profiles.
- Yonkers — the next stop south on Metro-North, with similar commute access and a much larger population.
- New Rochelle — the fastest-growing nearby city, gaining 6.6% in residents since 2020.
- Albany — the state capital, with a different price tier and a slowly growing population of 101,317.
- Buffalo — far cheaper for buyers willing to leave the New York City metro.
- Rochester — another upstate option with a lower cost basis than the downstate market.
Frequently Asked Questions
What is the average home price in Mount Vernon?
The average home value in Mount Vernon, NY is $562,874 as of February 2026. That figure represents the typical home across the city’s three ZIP codes — 10550, 10552, and 10553.
Are home prices going up or down in Mount Vernon?
Prices are up 2.3% over the past 12 months. The climb has been consistent for nine straight months, with the median rising from $550,288 in July 2025 to $562,874 in February 2026.
Is it cheaper to rent or buy in Mount Vernon?
Renting is cheaper by more than $1,100 a month. The average rent runs about $2,742, while a mortgage on the median home costs roughly $3,854 a month once Westchester property taxes and insurance are factored in.
What is the most affordable neighborhood in Mount Vernon?
ZIP code 10552 is the most affordable at $547,980 — about $15,000 below the citywide average. Rent there averages $2,712 a month, the lowest of the three ZIPs.
Methodology
Home values are based on the Zillow Home Value Index (ZHVI), a smoothed measure of typical home values in the 35th to 65th percentile range. Rent estimates use the Zillow Observed Rent Index (ZORI). Population figures come from the U.S. Census Bureau Population Estimates Program (2020-2024 vintage). All datasets are publicly available. Housing data updated 2026-02-28.