Average Home Price in Dallas TX (2026): Trends, ZIP Data & Forecast
$413,653. That’s what a typical home costs in Dallas right now — and it’s actually less than it was a year ago. The city’s median home value slipped 0.9% over the past 12 months, a modest pullback after years of aggressive price growth in the Dallas-Fort Worth metro.
Quick answer: The average home price in Dallas, TX is $413,653 as of February 2026, down 0.9% year over year according to Zillow.
Current Home Prices in Dallas
Here’s the snapshot for February 2026:
| Metric | Value |
|---|---|
| Median Home Value | $413,653 |
| Year-over-Year Change | -0.9% |
| Lowest ZIP Code Value | $140,039 |
| Highest ZIP Code Value | $1,050,710 |
| Number of ZIP Codes Tracked | 41 |
That sub-1% decline won’t move the needle for most homeowners. But it does signal a market that’s cooled off. A year ago, the median sat around $417,486. The drop is small in dollar terms — roughly $3,800 — but it marks a shift from the double-digit annual gains Dallas saw earlier this decade.
The price range across the city is enormous. You can find a home in the $140K range in one ZIP code and cross town to neighborhoods where the typical value exceeds $1 million. That $910,000 gap between the cheapest and most expensive areas tells you Dallas isn’t one market. It’s dozens.
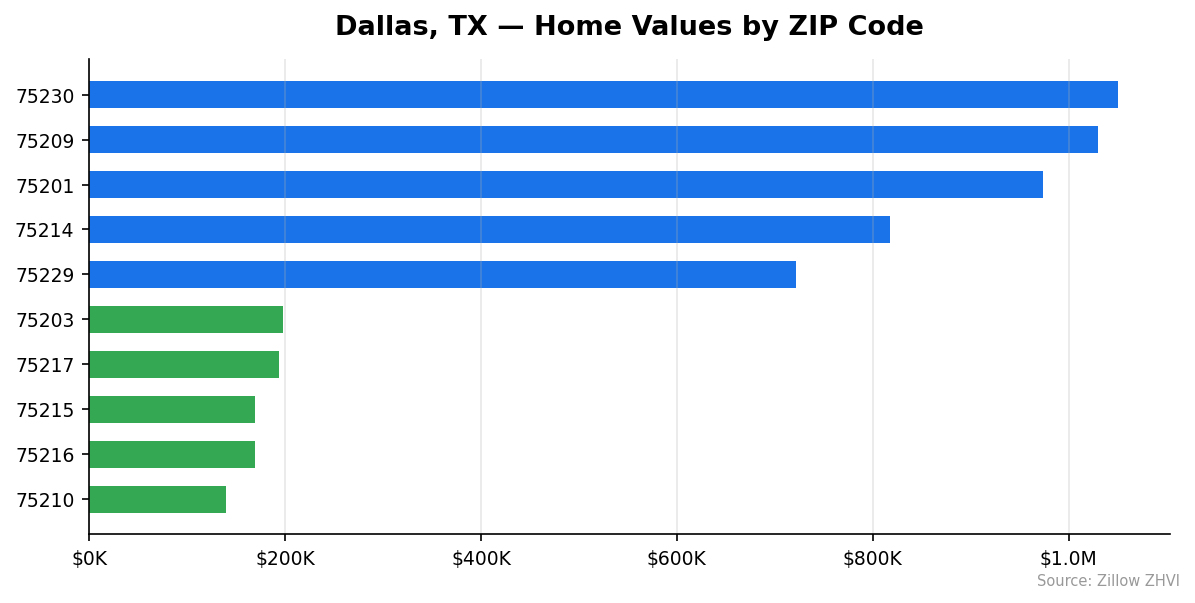
Dallas Home Prices by Neighborhood
All 41 tracked ZIP codes in Dallas, sorted by home value:
| ZIP Code | Typical Home Value | Typical Monthly Rent |
|---|---|---|
| 75230 | $1,050,710 | $1,750 |
| 75209 | $1,029,935 | $1,479 |
| 75201 | $973,261 | $2,150 |
| 75214 | $817,109 | $1,551 |
| 75229 | $721,401 | — |
| 75244 | $701,310 | $1,771 |
| 75238 | $617,033 | $1,333 |
| 75248 | $609,353 | $1,456 |
| 75252 | $606,462 | $1,207 |
| 75206 | $594,522 | $1,908 |
| 75218 | $542,917 | $1,531 |
| 75220 | $509,877 | $1,482 |
| 75204 | $498,072 | $1,955 |
| 75287 | $462,654 | $1,272 |
| 75219 | $415,914 | $2,020 |
| 75208 | $414,723 | $1,568 |
| 75240 | $400,253 | $1,613 |
| 75246 | $365,770 | $1,331 |
| 75254 | $301,010 | $1,328 |
| 75243 | $297,370 | $1,013 |
| 75226 | $297,673 | $1,574 |
| 75231 | $295,098 | $1,333 |
| 75249 | $286,116 | $2,270 |
| 75233 | $285,904 | — |
| 75236 | $275,787 | $1,538 |
| 75228 | $275,060 | $1,135 |
| 75202 | $271,763 | $2,337 |
| 75235 | $270,399 | $1,526 |
| 75237 | $263,574 | $1,297 |
| 75253 | $259,245 | $1,939 |
| 75223 | $246,974 | $1,482 |
| 75212 | $242,126 | $1,635 |
| 75232 | $234,086 | $1,872 |
| 75224 | $226,508 | $1,546 |
| 75227 | $221,626 | $1,534 |
| 75241 | $208,947 | $1,760 |
| 75203 | $197,953 | $1,519 |
| 75217 | $193,431 | $1,855 |
| 75215 | $168,945 | $1,690 |
| 75216 | $168,872 | $1,746 |
| 75210 | $140,039 | $1,350 |
Most Expensive ZIP Codes
75230 — $1,050,710. The priciest ZIP in Dallas by a wide margin, sitting more than 2.5 times the city median. Rents here run $1,750/month — moderate relative to the home values, which suggests most residents are long-term owners, not renters.
75209 — $1,029,935. Just behind at over $1 million, this area pairs high home values with comparatively lower rents at $1,479/month. The gap between home prices and rents is one of the largest in the city.
75201 — $973,261. Dallas’s urban core commands near-million-dollar home values with rents to match at $2,150/month — among the highest in the city.
Most Affordable ZIP Codes
75210 — $140,039. The most affordable ZIP in Dallas at 66% below the city median. Rents of $1,350/month here actually exceed what you’d expect given the low home prices.
75216 — $168,872. Homes here cost less than half the Dallas median. Rents are $1,746/month — higher than many neighborhoods with double the home values.
75215 — $168,945. Nearly identical in price to 75216. At $1,690/month in rent, this area shows the same pattern: low purchase prices paired with disproportionately high rents.
Rent vs Buy in Dallas
Rent data is available for 39 of Dallas’s 41 ZIP codes. The numbers tell an interesting story.
Rents range from $1,013/month in 75243 to $2,337/month in 75202. Most neighborhoods fall in the $1,300–$1,800 range.
Here’s the buy-side math. On the median home value of $413,653 with 20% down, you’re financing about $330,922. At a 7% interest rate on a 30-year fixed mortgage, that’s roughly $2,200/month in principal and interest alone — before property taxes, insurance, and maintenance.
| Cost | Monthly Amount |
|---|---|
| Typical Rent (mid-range) | $1,500 – $1,700 |
| Mortgage Payment (P&I, 20% down, 7%) | ~$2,200 |
| Estimated Property Tax + Insurance | ~$700 – $900 |
| Total Cost of Ownership (est.) | ~$2,900 – $3,100 |
On a pure monthly cash flow basis, renting is cheaper. But that comparison ignores equity buildup and potential appreciation. With prices currently flat to slightly negative, the equity argument is weaker than it was two years ago.
One pattern stands out in the ZIP data: several affordable neighborhoods have rents that are high relative to home values. In 75232, homes cost $234,086 but rent runs $1,872. In 75241, homes are $208,947 with rents at $1,760. Those ratios may attract investors.
Population Growth and Migration
Dallas had 1,326,087 residents in 2024, making it one of the largest cities in Texas and the country.
| Year | Population |
|---|---|
| 2020 | 1,303,426 |
| 2021 | 1,290,070 |
| 2022 | 1,303,012 |
| 2023 | 1,317,163 |
| 2024 | 1,326,087 |
The city grew 1.7% between 2020 and 2024. That growth wasn’t linear — Dallas actually lost about 13,000 residents between 2020 and 2021 before rebounding. Since 2021, the trajectory has been consistently upward.
How does Dallas compare to other Texas cities?
| City | 2024 Population | 4-Year Growth |
|---|---|---|
| Houston | 2,390,125 | 4.0% |
| San Antonio | 1,526,656 | 6.1% |
| Fort Worth | 1,008,106 | 9.1% |
| Austin | 993,588 | 2.9% |
| Lubbock | 272,086 | 5.4% |
| Dallas | 1,326,087 | 1.7% |
Dallas is growing, but it’s the slowest-growing major city in Texas. Fort Worth, right next door, is growing more than five times as fast. That’s worth watching. Faster population growth next door could shift demand — and prices — within the metro.
Still, 1.3 million people isn’t going anywhere. Steady population means steady baseline demand for housing.
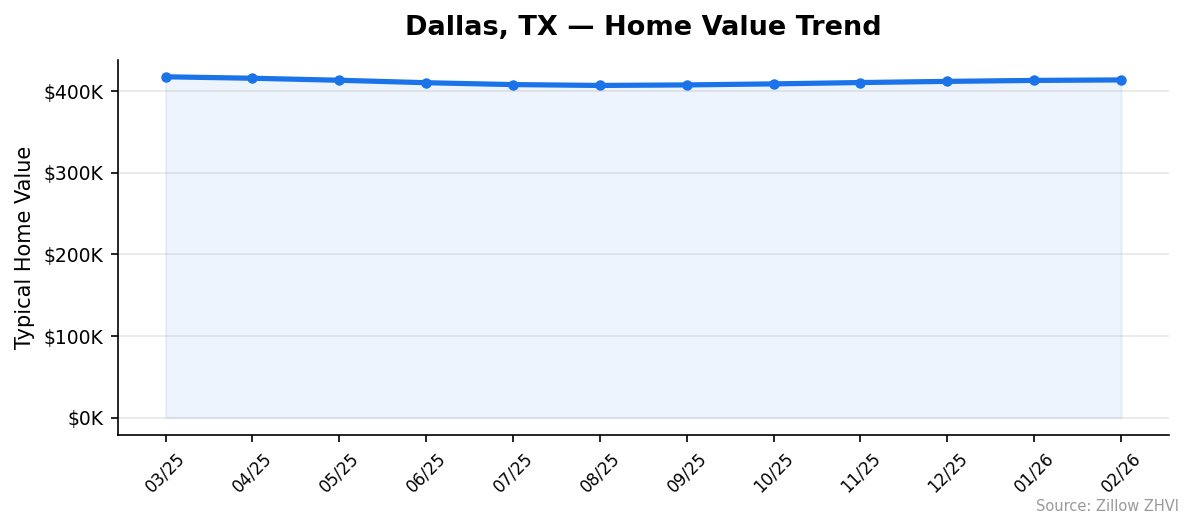
Dallas Housing Market Trends
Here’s how the median home value moved month by month over the past year:
| Month | Median Home Value | Change from Prior Month |
|---|---|---|
| March 2025 | $417,486 | — |
| April 2025 | $415,712 | -$1,774 |
| May 2025 | $413,251 | -$2,461 |
| June 2025 | $410,224 | -$3,027 |
| July 2025 | $407,937 | -$2,287 |
| August 2025 | $406,888 | -$1,049 |
| September 2025 | $407,528 | +$640 |
| October 2025 | $408,805 | +$1,277 |
| November 2025 | $410,435 | +$1,630 |
| December 2025 | $411,862 | +$1,427 |
| January 2026 | $413,048 | +$1,186 |
| February 2026 | $413,653 | +$605 |
The pattern is clear. Dallas prices declined for five straight months from March to August 2025, bottoming out at $406,888. Then the market reversed. Prices have climbed for six consecutive months since September 2025.
But the recovery is losing steam. Monthly gains have shrunk from $1,630 in November to just $605 in February. The market isn’t falling — but it’s not accelerating either. It’s flattening.
Is Dallas a Good Place to Buy in 2026?
The data points to a balanced market. Prices are essentially flat year over year (-0.9%), which means neither buyers nor sellers have a strong upper hand.
For buyers, that’s a better position than two or three years ago when prices were climbing fast. You’re not chasing a moving target. You have time to shop, compare, and negotiate.
The wide price range across ZIP codes gives you options. If $413K is your budget, you’re right at the city median. But you can find neighborhoods well below $200K if you look south, or stretch past $600K heading north.
For sellers, the softness is mild. A 0.9% decline doesn’t create urgency, but it does mean you shouldn’t expect bidding wars in most neighborhoods. Price your home based on current comps, not last year’s peak.
One factor to watch: mortgage rates. At 7%, the monthly payment on a median Dallas home is steep. If rates drop, buying power expands and prices could respond. If they stay elevated, expect this flat trend to continue.
Dallas Housing Market Outlook for 2026-2027
The six-month rebound from August 2025 through February 2026 suggests the floor is in. Dallas prices aren’t in freefall — the mid-2025 dip was shallow and short-lived.
But the momentum is fading. Monthly gains decelerated from $1,630 to $605 over the last four months. If that pace continues, prices may plateau near current levels through spring and summer 2026.
The 12-month trend suggests Dallas will trade sideways. A year from now, expect the median to be within a few percent of where it sits today — barring a major shift in interest rates or local employment.
Dallas’s slower population growth compared to its Texas peers could limit upside pressure. Fort Worth, San Antonio, and Austin are all absorbing more new residents, which means faster demand growth in those markets relative to Dallas.
Similar Markets in TX
If you’re considering Dallas, these other Texas cities offer useful comparisons:
- Houston — Texas’s largest city with 2.39 million people and stronger population growth at 4.0%.
- El Paso — A far more affordable option on the state’s western border.
- San Antonio — Growing at 6.1% with a population larger than Dallas.
- Frisco — A fast-growing suburb north of Dallas in the same metro area.
- Grand Prairie — Another DFW suburb that may offer lower price points than Dallas proper.
Frequently Asked Questions
What is the average home price in Dallas?
The average home price in Dallas is $413,653 as of February 2026. That figure represents the Zillow Home Value Index, which measures typical values in the 35th to 65th percentile range. Across the city’s 41 tracked ZIP codes, values span from $140,039 to $1,050,710.
Are home prices going up or down in Dallas?
Dallas home prices are down 0.9% compared to a year ago. However, the monthly trend shows prices have been rising since September 2025 after a dip that bottomed out in August. The current direction is slowly upward, though gains are decelerating.
Is it cheaper to rent or buy in Dallas?
Renting is cheaper on a monthly basis. Typical rents in Dallas range from about $1,000 to $2,300 depending on the neighborhood. A mortgage on the median home at 7% with 20% down runs about $2,200/month before taxes and insurance. Total ownership costs likely run $2,900–$3,100/month.
What is the most affordable neighborhood in Dallas?
ZIP code 75210 has the lowest typical home value in Dallas at $140,039 — roughly 66% below the city-wide median of $413,653. Other affordable areas include 75216 ($168,872) and 75215 ($168,945), both well under $200,000.
Methodology
Home values are based on the Zillow Home Value Index (ZHVI), a smoothed measure of typical home values in the 35th to 65th percentile range. Rent estimates use the Zillow Observed Rent Index (ZORI). Population figures come from the U.S. Census Bureau Population Estimates Program (2020-2024 vintage). All datasets are publicly available. Housing data updated 2026-02-28.