Frisco Home Prices: $636K, Down 4.2% — 4 ZIPs Analyzed (2026)
Prices dropped for the 12th straight month in Frisco. The median home is now worth $635,704 — down 4.2% from a year ago and nearly $28,000 less than the March 2025 peak. For a city that added 32,000 residents in four years, that price correction tells a story about supply finally catching up with demand.
Quick answer: The average home price in Frisco, TX is $635,704 as of February 2026, down 4.2% year over year according to Zillow.
Current Home Prices in Frisco
| Metric | Value |
|---|---|
| Median Home Value | $635,704 |
| Year-over-Year Change | -4.2% |
| Lowest Price (by ZIP) | $564,249 |
| Highest Price (by ZIP) | $667,986 |
| Number of ZIP Codes | 4 |
| Data Month | February 2026 |
The average home price in Frisco TX sits at $635,704. That’s a drop of roughly $28,200 compared to March 2025, when homes peaked at $663,904.
The price range across Frisco spans about $104,000. You can find a typical home for as low as $564K in the most affordable ZIP or pay nearly $668K in the priciest neighborhood. That gap matters if you’re flexible on location.
A 4.2% year-over-year decline may not sound dramatic, but in dollar terms it means a buyer today saves about $28,000 compared to buying at the peak. On a 30-year mortgage, that translates to roughly $185 less per month in payments.
Frisco remains one of the more expensive cities in the Dallas-Fort Worth metro. But the sustained downward trend puts it in a different position than it was 18 months ago, when prices were still climbing.
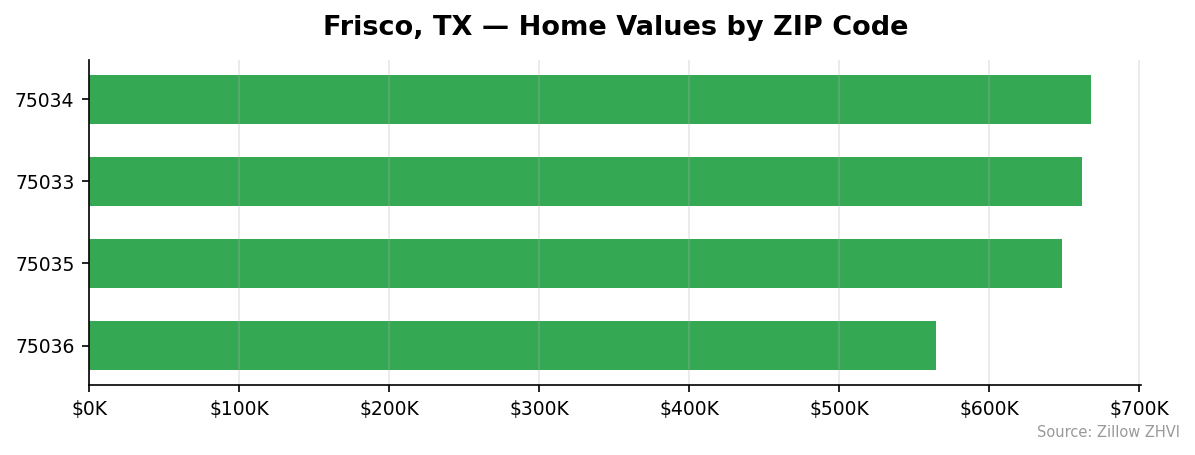
Frisco Home Prices by Neighborhood
| ZIP Code | Median Home Value | Avg. Monthly Rent |
|---|---|---|
| 75034 | $667,986 | $1,665 |
| 75033 | $661,871 | $1,679 |
| 75035 | $648,709 | $2,304 |
| 75036 | $564,249 | $2,364 |
Most Expensive
75034 leads Frisco at $667,986 — about $32,000 above the city average, yet it carries one of the lowest rents at $1,665 per month. 75033 follows closely at $661,871 with similarly low rents of $1,679. Both ZIPs sit well above the city median, suggesting more owner-occupied, higher-end housing stock.
Most Affordable
75036 is the clear bargain at $564,249. That’s $71,455 below the city average — an 11% discount. Interestingly, 75036 has the highest average rent at $2,364, which signals strong rental demand in the area. If you’re looking for the most affordable entry point in Frisco, this ZIP is where to start.
Rent vs Buy in Frisco
The average rent across Frisco’s four ZIP codes works out to about $2,003 per month. Buying is a different equation entirely.
| Cost Type | Monthly Amount |
|---|---|
| Average Rent | ~$2,003 |
| Estimated Mortgage (20% down, 7%) | ~$3,384 |
| Difference | ~$1,381 |
A buyer putting 20% down on a $635,704 home finances about $508,563. At a 7% interest rate over 30 years, the principal and interest payment comes to roughly $3,384 per month. That doesn’t include property taxes, insurance, or HOA fees — all of which run high in Frisco.
You’d pay about $1,381 more per month to own versus rent. Over a year, that’s $16,572 in extra housing costs before any maintenance or repairs.
With prices declining 4.2% year over year, buying right now means you could see your home lose value in the short term. Renters dodge that risk entirely. On the flip side, if you plan to stay 7+ years, the math may eventually work in your favor — especially if rates come down and you refinance.
One odd pattern in the data: the cheapest ZIP to buy (75036 at $564K) has the highest rent ($2,364). The most expensive ZIP to buy (75034 at $668K) has the lowest rent ($1,665). That disconnect suggests different housing dynamics in each area.
Population Growth and Migration
Frisco grew 16% in four years. The city added 32,444 residents between 2020 and 2024, pushing the population to 235,208.
| Year | Population |
|---|---|
| 2020 | 202,764 |
| 2021 | 211,129 |
| 2022 | 220,421 |
| 2023 | 227,005 |
| 2024 | 235,208 |
That’s roughly 8,100 new residents per year. Growth has been steady — no single boom year, just consistent gains.
How does Frisco compare to other Texas cities?
| City | 2024 Population | 4-Year Growth |
|---|---|---|
| Frisco | 235,208 | 16.0% |
| Fort Worth | 1,008,106 | 9.1% |
| San Antonio | 1,526,656 | 6.1% |
| Lubbock | 272,086 | 5.4% |
| Houston | 2,390,125 | 4.0% |
| Austin | 993,588 | 2.9% |
Frisco’s growth rate is nearly double Fort Worth’s and more than five times Austin’s. That population pressure keeps housing demand elevated even as prices soften. More people means more households competing for inventory, which puts a floor under how far prices can fall.
Frisco Housing Market Trends
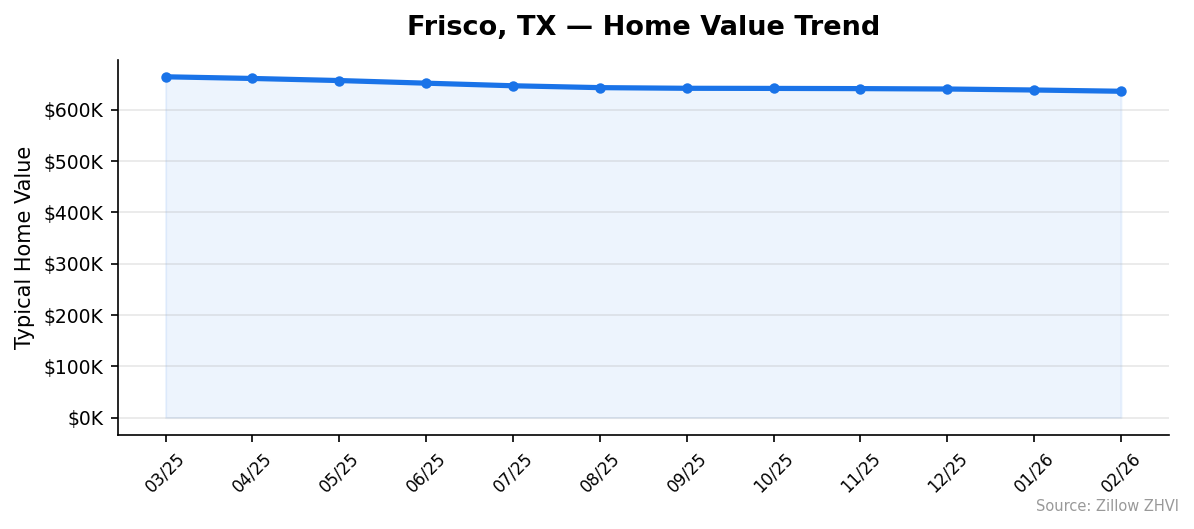
Here’s how Frisco home values moved over the past 12 months.
| Month | Median Value | Min (by ZIP) | Max (by ZIP) |
|---|---|---|---|
| Feb 2026 | $635,704 | $564,249 | $667,986 |
| Jan 2026 | $638,165 | $566,409 | $669,595 |
| Dec 2025 | $640,101 | $567,995 | $670,149 |
| Nov 2025 | $640,868 | $568,731 | $669,209 |
| Oct 2025 | $641,251 | $569,321 | $667,874 |
| Sep 2025 | $641,500 | $569,932 | $667,191 |
| Aug 2025 | $642,776 | $571,372 | $668,371 |
| Jul 2025 | $646,410 | $574,259 | $672,543 |
| Jun 2025 | $651,462 | $577,823 | $678,376 |
| May 2025 | $656,590 | $581,462 | $684,324 |
| Apr 2025 | $660,647 | $584,377 | $688,967 |
| Mar 2025 | $663,904 | $586,884 | $692,277 |
Every single month showed a decline. The pace was steeper in the first half — prices dropped about $5,000 per month from March through August 2025. Then the slide slowed to roughly $1,500 per month from September onward.
The total decline from March 2025 to February 2026 was $28,200, or about 4.2%. All ZIP codes tracked downward together. No neighborhood bucked the trend.
Is Frisco a Good Place to Buy in 2026?
The data points to a buyer-friendly market. Twelve consecutive months of price declines give you negotiating power that didn’t exist a year ago.
A few things work in buyers’ favor. First, the $28,000 price drop since peak means less risk of overpaying. Second, the pace of decline is slowing — the last three months averaged just $1,500 per month, suggesting the market is approaching a floor. Third, population growth of 16% over four years means underlying demand remains strong. Frisco isn’t shrinking; prices are correcting after a period of overvaluation.
The risk: prices could still drift lower. If you buy at $636K and values drop another 2-3%, you’re temporarily underwater. That only matters if you plan to sell soon.
For long-term buyers, the combination of declining prices and strong population growth creates a window. You’re buying into a market with real demand at prices well below last year’s peak.
Frisco Housing Market Outlook for 2026-2027
The 12-month trend shows a clear deceleration. Prices fell $5,000 per month in spring and summer 2025, but only $1,500 per month in late 2025 and early 2026. If the current pace continues, Frisco home values could settle in the $625,000-$630,000 range by mid-2026.
The slowdown in monthly declines suggests the market is stabilizing rather than collapsing. A 16% population growth rate doesn’t vanish overnight — that demand will eventually absorb excess inventory.
The three-month trend from December to February shows consistent but modest drops of about $2,000 per month. Absent a major economic shock, prices are more likely to flatten than to accelerate downward. A return to year-over-year gains would likely require lower mortgage rates or a significant pickup in job growth in the DFW metro.
Similar Markets in TX
If you’re shopping in Frisco, these Texas cities are worth comparing.
- Katy — A Houston suburb with a similar family-oriented feel, typically at a lower price point than Frisco.
- Dallas — Just 30 miles south, Dallas offers urban living and a wider range of price points.
- Grand Prairie — Situated between Dallas and Fort Worth, Grand Prairie gives buyers DFW access at a lower cost.
- Sugar Land — Another fast-growing Texas suburb with strong schools, often compared to Frisco for quality of life.
- Spring — A master-planned community north of Houston that attracts a similar buyer demographic.
Frequently Asked Questions
What is the average home price in Frisco?
The average home price in Frisco, TX is $635,704 as of February 2026. Across the city’s four tracked ZIP codes, values range from $564,249 in the 75036 area to $667,986 in the 75034 area. That’s a spread of about $104,000 depending on where in Frisco you buy.
Are home prices going up or down in Frisco?
Prices are going down. Frisco home values have declined for 12 consecutive months, falling 4.2% year over year. The median dropped from $663,904 in March 2025 to $635,704 in February 2026. The rate of decline has slowed in recent months, but the direction is still clearly downward.
Is it cheaper to rent or buy in Frisco?
Renting is cheaper right now. The average rent across Frisco runs about $2,003 per month. A mortgage on a median-priced home with 20% down at 7% interest costs roughly $3,384 per month — before taxes, insurance, or HOA fees. That’s a gap of about $1,381 per month in favor of renting.
What is the most affordable neighborhood in Frisco?
ZIP code 75036 is the most affordable, with a median home value of $564,249. That’s about $71,000 below the city average. Despite the lower purchase price, 75036 actually has the highest average rent at $2,364, which may indicate strong rental demand in that area.
Methodology
Home values are based on the Zillow Home Value Index (ZHVI), a smoothed measure of typical home values in the 35th to 65th percentile range. Rent estimates use the Zillow Observed Rent Index (ZORI). Population figures come from the U.S. Census Bureau Population Estimates Program (2020-2024 vintage). All datasets are publicly available. Housing data updated 2026-02-28.