Desert Hot Springs Home Prices: $348K, Down 0.1% — 3 ZIPs Analyzed (2026)
$348,232. That is what a typical home in Desert Hot Springs costs as of February 2026. Prices slipped 0.1% over the past year — flat, in practice — but the last four months show a small bounce off the October low.
Quick answer: The average home price in Desert Hot Springs, CA is $348,232 as of February 2026, down 0.1% year over year according to Zillow.
Current Home Prices in Desert Hot Springs
The numbers tell a story of a market that stopped falling but has not started climbing in any real way.
| Metric | Value |
|---|---|
| Median home value | $348,232 |
| Year-over-year change | -0.1% |
| Cheapest ZIP | $269,938 (92258) |
| Most expensive ZIP | $399,001 (92241) |
| Spread between ZIPs | $129,063 |
| ZIP codes covered | 3 |
| Metro area | Riverside-San Bernardino-Ontario, CA |
| Data through | February 2026 |
The 0.1% annual change is statistical noise. A year ago the typical home was worth $348,520. Today it is $348,232. The difference is $288.
What is more interesting is the month-to-month direction. October 2025 was the bottom at $343,077. February 2026 is $348,232. That is a $5,155 gain over four months — a pace of about 1.5% on an annualized basis if it continues.
The price spread between ZIPs is wide for a city this size. The most expensive neighborhood costs 48% more than the cheapest. In a market with only 3 ZIPs, that gap matters: which side of town you buy on changes your monthly payment by hundreds of dollars.
Compared with the broader Riverside-San Bernardino-Ontario metro, Desert Hot Springs sits well below the regional average. This is one of the more affordable doors into Coachella Valley homeownership.
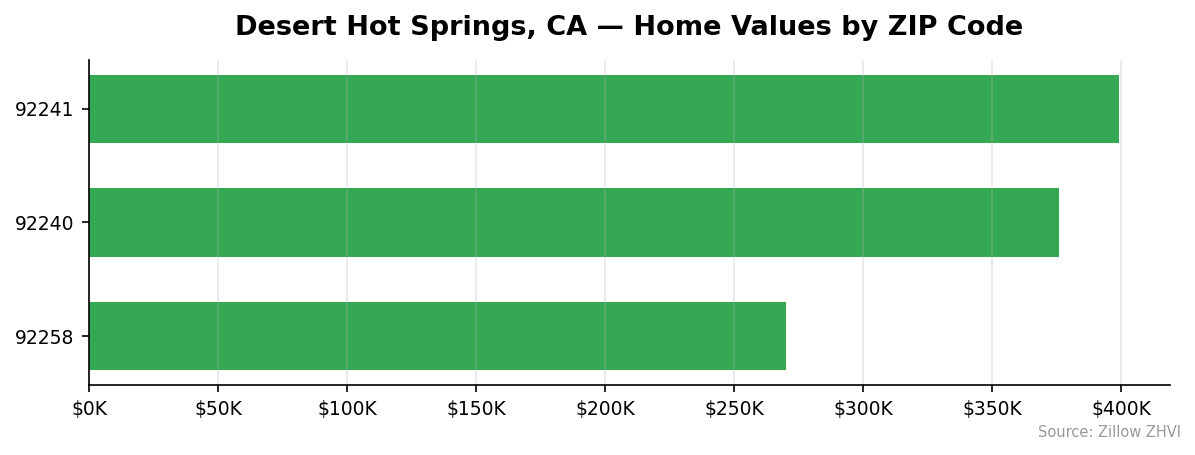
Desert Hot Springs Home Prices by Neighborhood
Three ZIPs cover the city, and the price gap between them is the largest piece of useful information for any buyer.
| ZIP Code | Median Home Value | vs City Avg |
|---|---|---|
| 92241 | $399,001 | +14.6% |
| 92240 | $375,758 | +7.9% |
| 92258 | $269,938 | -22.5% |
Most Expensive
- 92241 — $399,001. The top of the local market, $50,769 above the city average.
- 92240 — $375,758. The largest residential ZIP and the only one with rent data, where typical rents run $1,981 per month.
Most Affordable
- 92258 — $269,938. The cheapest entry point in the city, roughly $78,000 below the city average and $129,000 below the most expensive ZIP. For a buyer with a fixed budget, this is where the math works.
With only three ZIPs to choose from, your search is less about neighborhood-hunting and more about price tier. The $130,000 spread translates to roughly $700 a month in mortgage payment differences before taxes.
Rent vs Buy in Desert Hot Springs
Rent data is available for ZIP 92240, the largest ZIP in the city. The typical rent there is $1,981 per month.
Run the buy-side math against the median home price of $348,232:
| Scenario | Monthly Cost |
|---|---|
| Rent (92240, ZORI) | $1,981 |
| Mortgage P&I, 20% down at 7% | ~$1,853 |
| Mortgage P&I, 10% down at 7% | ~$2,085 |
| Mortgage P&I, 5% down at 7% | ~$2,201 |
Principal and interest alone come in close to the rent number. With 20% down, the mortgage runs about $128 less per month than rent. With 10% down, you cross over and pay more than renters.
But these numbers exclude property tax, insurance, HOA, and maintenance. Add those and most buyers will pay more per month than they would to rent. The trade-off: every payment chips away at principal, and you keep any appreciation. Renters do not.
The break-even depends on how long you stay. With prices essentially flat year over year, betting on quick appreciation is not the right reason to buy here right now. Buy if you plan to stay five years or more. Rent if your timeline is shorter.
Population Growth and Migration
The city is growing — slowly, but consistently.
| Year | Population |
|---|---|
| 2020 | 32,554 |
| 2021 | 32,879 |
| 2022 | 33,156 |
| 2023 | 33,521 |
| 2024 | 33,917 |
Desert Hot Springs added 1,363 residents over four years. That is a 4.2% increase, or about 1% per year. Every year in the trend shows growth — there is no flat year, no decline.
Stack that against other California cities for context:
| City | 2024 Population | 4-Year Growth |
|---|---|---|
| Desert Hot Springs | 33,917 | 4.2% |
| Bakersfield | 417,468 | 3.0% |
| Sacramento | 535,798 | 1.9% |
| San Diego | 1,404,452 | 1.4% |
| Fresno | 550,105 | 1.4% |
| Oakland | 443,554 | 0.6% |
Desert Hot Springs is growing faster than every major California city on this list. The base is small — adding 396 people in 2024 alone is a different story from a city like San Diego adding tens of thousands. But the percentage matters for housing demand.
A city growing 1% a year needs new housing every year. That floor under demand is part of why prices stopped falling and started inching up. People are moving in, not out.
Desert Hot Springs Housing Market Trends
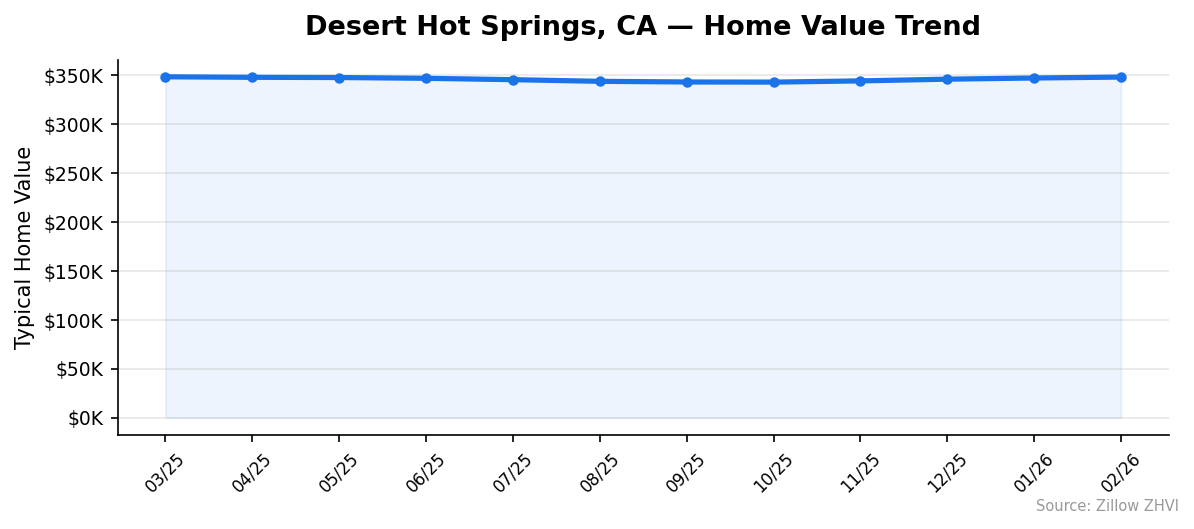
The 12-month picture shows a market that bottomed in October 2025 and has been climbing modestly since.
| Month | Median Value | Change |
|---|---|---|
| March 2025 | $348,520 | — |
| April 2025 | $347,985 | -0.2% |
| May 2025 | $347,767 | -0.1% |
| June 2025 | $346,974 | -0.2% |
| July 2025 | $345,567 | -0.4% |
| August 2025 | $343,886 | -0.5% |
| September 2025 | $343,215 | -0.2% |
| October 2025 | $343,077 | -0.04% |
| November 2025 | $344,319 | +0.4% |
| December 2025 | $346,088 | +0.5% |
| January 2026 | $347,282 | +0.3% |
| February 2026 | $348,232 | +0.3% |
The market peaked in March 2025, fell for seven straight months to October, then turned around. Four consecutive months of gains have nearly erased the entire decline.
The total drop from peak to trough was 1.6%. The recovery so far is 1.5%. The market is back within $288 of where it was a year ago.
Direction matters more than magnitude here. A market that stops falling and starts rising — even slowly — sends a different signal than one still bleeding.
Is Desert Hot Springs a Good Place to Buy in 2026?
The data points to a market in the early stages of a turn.
Three things stand out. First, prices have been climbing for four straight months after a seven-month slide. Second, population growth is steady at 1% a year — faster than any major city in the state. Third, entry prices remain accessible: the cheapest ZIP is under $270,000, which is unusual for California.
The case for waiting: the recovery is small. The $5,155 gain since October could stall if mortgage rates rise or buyer demand softens. There is no rush.
The case for buying now: rent and mortgage costs are close to parity, the population trend supports demand, and you can find homes under $300,000 in 92258. If you plan to stay five years, the math works.
This is a buyer’s market that may not stay one for long. Inventory and pricing power favor buyers today. If the four-month upward trend extends through summer, that balance will shift.
Desert Hot Springs Housing Market Outlook for 2026-2027
The 3-month trend suggests prices will keep climbing in the near term. Median values rose 0.3% in each of the last three months. If the current pace continues, the typical home would cross $355,000 by mid-2026.
Two factors could derail that path. A change in mortgage rates would shift buyer demand quickly. A national pullback in housing would pull this market with it.
Two factors support continued gains. Population growth at 4.2% over four years is faster than the state average. The price floor in ZIP 92258 brings buyers who get priced out of pricier Coachella Valley markets.
Six months from now, expect prices to be modestly higher than today, assuming the current monthly pattern holds. The data does not support a forecast of sharp gains or sharp losses. Slow and steady is what the trend is showing.
Similar Markets in CA
If you are weighing other California options:
- Riverside — Same metro area as Desert Hot Springs, larger and typically pricier.
- Bakersfield — Another inland California option with similar affordability and steady population growth.
- Fresno — Larger Central Valley market for buyers who want more inventory.
- Fontana — Inland Empire alternative with comparable mid-tier pricing.
- Long Beach — Coastal alternative for buyers willing to pay a steep premium for ocean access.
Frequently Asked Questions
What is the average home price in Desert Hot Springs?
The average home price in Desert Hot Springs, CA is $348,232 as of February 2026. This is the Zillow Home Value Index across 3 ZIP codes — 92240, 92241, and 92258 — covering the full city.
Are home prices going up or down in Desert Hot Springs?
Prices are down 0.1% year over year, which is essentially flat. The market bottomed in October 2025 at $343,077 and has gained 1.5% over the four months since, suggesting the decline has ended.
Is it cheaper to rent or buy in Desert Hot Springs?
Typical rent in ZIP 92240 is $1,981 per month. A mortgage on the $348,232 median home with 20% down at 7% runs about $1,853 in principal and interest, but adding taxes, insurance, and maintenance usually pushes total ownership cost above rent.
What is the most affordable neighborhood in Desert Hot Springs?
ZIP 92258 is the cheapest, with a median value of $269,938 — about 22.5% below the city average and $129,000 less than the most expensive ZIP, 92241, at $399,001.
Methodology
Home values are based on the Zillow Home Value Index (ZHVI), a smoothed measure of typical home values in the 35th to 65th percentile range. Rent estimates use the Zillow Observed Rent Index (ZORI). Population figures come from the U.S. Census Bureau Population Estimates Program (2020-2024 vintage). All datasets are publicly available. Housing data updated 2026-02-28.