Average Home Price in Houston TX (2026): Trends, Data & Analysis
$320,441. That’s what a typical home costs in Houston right now — and it’s less than it was a year ago.
The Houston housing market has cooled. Prices are down 1.4% year over year as of February 2026, and the 12-month trend shows a market that spent most of 2025 sliding before flattening out. Across 97 ZIP codes, home values range from under $137K to over $1.6 million.
Quick answer: The average home price in Houston, TX is $320,441 as of February 2026, down 1.4% year over year according to Zillow.
Current Home Prices in Houston
| Metric | Value |
|---|---|
| Median Home Value | $320,441 |
| Year-over-Year Change | -1.4% |
| Lowest ZIP Code Value | $136,923 |
| Highest ZIP Code Value | $1,654,977 |
| Number of ZIP Codes | 97 |
| Data as of | February 2026 |
Houston’s median sits at $320,441 — a number that’s held remarkably steady over the past three months. In January it was $320,498. In December, $320,003. The market has found a floor after declining through most of 2025.
That 1.4% annual drop translates to roughly $4,600 less than what a typical Houston home was worth in early 2025. Not a crash. More of a slow deflation.
The spread between the cheapest and most expensive ZIP codes tells the real story of Houston’s housing market. A $1.5 million gap separates the bottom from the top. You can buy a home in some neighborhoods for what amounts to a down payment in others.
Houston Home Prices by Neighborhood
Houston spans 97 ZIP codes with massive price variation. Here’s the full breakdown:
| ZIP Code | Typical Home Value | Typical Rent |
|---|---|---|
| 77002 | $251,198 | $1,985 |
| 77003 | $356,300 | $1,818 |
| 77004 | $353,061 | $1,887 |
| 77005 | $1,654,977 | $2,011 |
| 77006 | $561,246 | $1,611 |
| 77007 | $505,232 | $1,835 |
| 77008 | $585,990 | $1,803 |
| 77009 | $380,348 | $1,675 |
| 77011 | $185,513 | $1,392 |
| 77012 | $153,074 | — |
| 77013 | $191,611 | $844 |
| 77014 | $248,508 | $1,154 |
| 77015 | $196,601 | $1,005 |
| 77016 | $160,223 | $1,636 |
| 77017 | $179,888 | $1,277 |
| 77018 | $532,254 | $2,099 |
| 77019 | $690,608 | $1,859 |
| 77020 | $162,622 | $2,089 |
| 77021 | $194,568 | $1,727 |
| 77022 | $209,869 | $1,441 |
| 77023 | $246,931 | $1,316 |
| 77024 | $1,397,374 | $1,743 |
| 77025 | $470,252 | $1,381 |
| 77026 | $142,240 | $1,127 |
| 77027 | $817,774 | $1,832 |
| 77028 | $160,493 | $1,625 |
| 77030 | $522,807 | $1,710 |
| 77031 | $254,030 | — |
| 77032 | $184,593 | $1,462 |
| 77033 | $141,250 | $1,714 |
| 77034 | $223,424 | $962 |
| 77035 | $256,043 | $1,153 |
| 77036 | $165,671 | $957 |
| 77037 | $196,743 | — |
| 77038 | $215,500 | $1,538 |
| 77039 | $187,431 | — |
| 77040 | $259,282 | $1,297 |
| 77041 | $297,369 | $1,686 |
| 77042 | $267,880 | $1,343 |
| 77043 | $387,399 | $1,663 |
| 77044 | $284,822 | $1,861 |
| 77045 | $195,384 | $1,600 |
| 77046 | $325,000 | $1,581 |
| 77047 | $251,281 | $1,962 |
| 77048 | $216,761 | $1,606 |
| 77049 | $241,227 | $1,406 |
| 77050 | $177,172 | — |
| 77051 | $189,731 | $1,812 |
| 77053 | $195,537 | $1,774 |
| 77054 | $136,923 | $1,335 |
| 77055 | $606,966 | $1,512 |
| 77056 | $664,271 | $1,711 |
| 77057 | $272,123 | $1,384 |
| 77058 | $238,767 | $1,451 |
| 77059 | $442,900 | — |
| 77060 | $193,475 | $1,138 |
| 77061 | $228,038 | $1,106 |
| 77062 | $308,826 | $1,583 |
| 77063 | $245,631 | $1,258 |
| 77064 | $268,731 | $1,425 |
| 77065 | $286,688 | $1,359 |
| 77066 | $243,649 | $1,189 |
| 77067 | $211,046 | $1,484 |
| 77068 | $312,498 | — |
| 77069 | $327,984 | $1,264 |
| 77070 | $294,330 | $1,495 |
| 77071 | $236,894 | $1,646 |
| 77072 | $203,527 | $1,574 |
| 77073 | $229,470 | $1,842 |
| 77074 | $213,919 | $1,712 |
| 77075 | $250,438 | $1,284 |
| 77076 | $184,290 | $1,962 |
| 77077 | $385,247 | $1,334 |
| 77078 | $165,299 | $1,521 |
| 77079 | $705,459 | $1,418 |
| 77080 | $348,753 | $1,259 |
| 77081 | $245,293 | $1,139 |
| 77082 | $253,083 | $1,277 |
| 77083 | $260,314 | $1,938 |
| 77084 | $265,224 | $1,554 |
| 77085 | $222,665 | $1,529 |
| 77086 | $215,552 | $1,431 |
| 77087 | $177,878 | $1,529 |
| 77088 | $210,968 | $1,750 |
| 77089 | $268,417 | $1,538 |
| 77090 | $246,105 | $1,109 |
| 77091 | $266,362 | $1,641 |
| 77092 | $274,164 | $1,626 |
| 77093 | $164,377 | $1,335 |
| 77094 | $553,802 | $1,625 |
| 77095 | $324,875 | $1,485 |
| 77096 | $425,368 | $1,336 |
| 77098 | $699,110 | $1,718 |
| 77099 | $217,592 | $1,049 |
| 77339 | $294,368 | $1,576 |
| 77345 | $406,627 | — |
| 77598 | $259,394 | $1,455 |
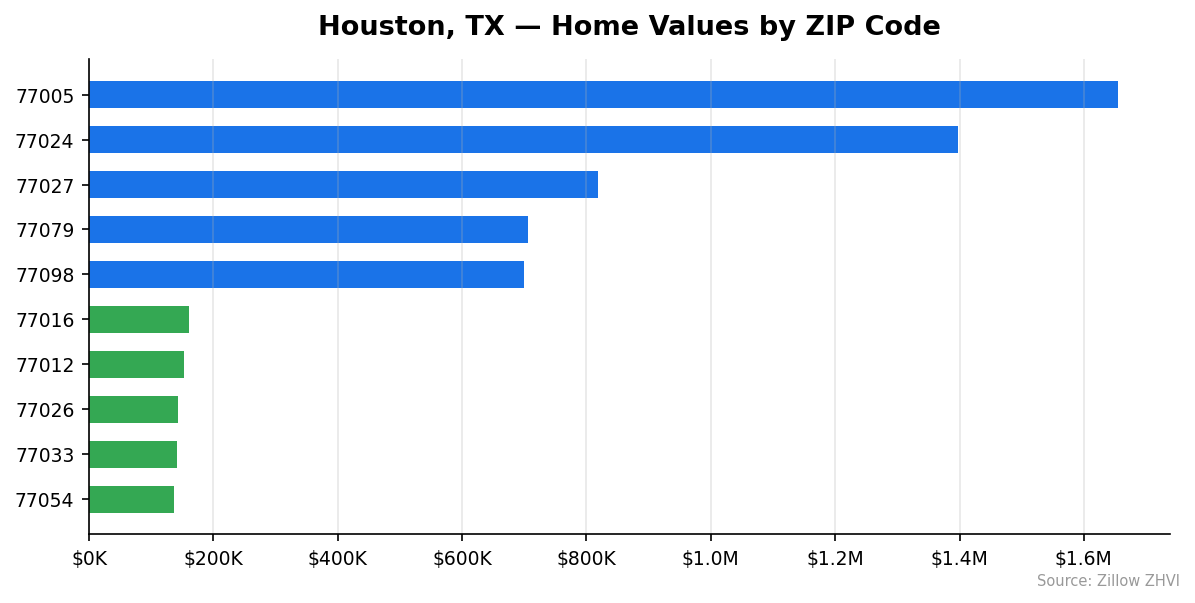
Most Expensive Neighborhoods
77005 — $1,654,977. This is Houston’s priciest ZIP by a wide margin, with home values more than five times the city median. Typical rent here runs $2,011/month — high, but nowhere near proportional to purchase prices.
77024 — $1,397,374. The Memorial area commands values over four times the Houston average, with rents around $1,743/month. Buyers here pay a steep premium.
77027 — $817,774. At 2.5x the city median, this ZIP sits in the Galleria/River Oaks corridor. Rents average $1,832/month.
Most Affordable Neighborhoods
77054 — $136,923. Houston’s cheapest ZIP code, priced at just 43% of the city median. Rents average $1,335/month, which makes the rent-to-price ratio unusually high here.
77033 — $141,250. Home values sit at 44% of the city average. Rents run $1,714/month — more than 1.2% of home value monthly, suggesting strong rental demand relative to purchase prices.
77026 — $142,240. Another sub-$150K neighborhood where rents ($1,127/month) remain moderate relative to the rest of the city.
Rent vs Buy in Houston
Renting is cheaper on a monthly basis for most Houston neighborhoods — but not by as much as you might expect.
Rents across Houston’s 97 ZIP codes range from $844/month in 77013 to $2,099/month in 77018. Most ZIPs fall in the $1,300–$1,700 range.
Here’s the math on buying at the city median:
| Monthly Cost | |
|---|---|
| Median Home Price | $320,441 |
| Down Payment (20%) | $64,088 |
| Loan Amount | $256,353 |
| Estimated Mortgage (7%, 30-yr) | ~$1,705 |
| Property Tax (~2.2%) | ~$588 |
| Insurance (est.) | ~$250 |
| Total Monthly (Buy) | ~$2,543 |
| Typical Rent | ~$1,500 |
Buying costs roughly $1,000 more per month than renting when you factor in property taxes and insurance. Texas has no state income tax, but property tax rates are among the highest in the country — that 2.2% rate adds nearly $600/month to ownership costs.
The buy calculation improves in cheaper ZIPs. In 77054, where homes cost $136,923, a mortgage payment would be roughly $730/month before taxes. With rent there at $1,335, buying starts to look attractive if you can handle the upfront costs.
Population Growth and Migration
Houston is getting bigger. The city’s population hit 2,390,125 in 2024, up 4.0% from 2,298,945 in 2020. That’s 91,180 new residents in four years.
| Year | Population |
|---|---|
| 2020 | 2,298,945 |
| 2021 | 2,291,070 |
| 2022 | 2,314,258 |
| 2023 | 2,346,908 |
| 2024 | 2,390,125 |
The dip in 2021 stands out. Houston lost about 8,000 residents that year before rebounding in 2022 and accelerating since. The 2023-to-2024 jump of 43,217 people was the largest single-year gain in the dataset.
How does Houston compare to other Texas cities?
| City | 2024 Population | Growth (2020–2024) |
|---|---|---|
| Houston | 2,390,125 | 4.0% |
| Fort Worth | 1,008,106 | 9.1% |
| San Antonio | 1,526,656 | 6.1% |
| Lubbock | 272,086 | 5.4% |
| Austin | 993,588 | 2.9% |
| Arlington | 403,672 | 2.4% |
Houston’s 4.0% growth rate trails Fort Worth, San Antonio, and Lubbock in percentage terms. But in raw numbers, Houston added far more people than any of them. Nearly 100,000 new residents need housing, which creates sustained demand even as prices soften.
Houston Housing Market Trends
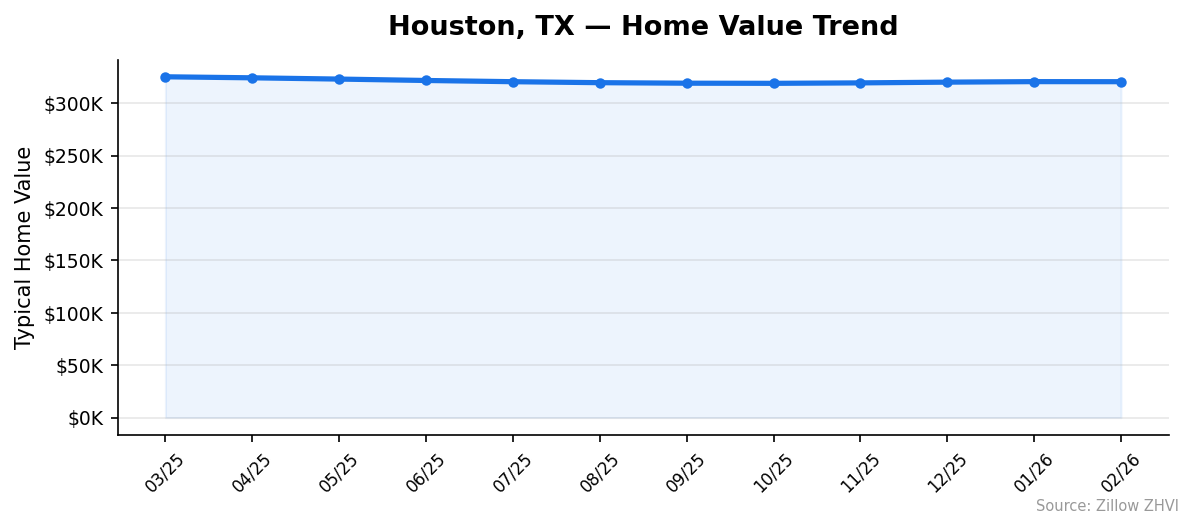
The 12-month trend tells a clear story: decline, then stabilization.
| Month | Median Home Value | Min | Max |
|---|---|---|---|
| March 2025 | $325,117 | $147,554 | $1,602,477 |
| April 2025 | $324,137 | $147,123 | $1,609,068 |
| May 2025 | $322,931 | $146,178 | $1,613,915 |
| June 2025 | $321,596 | $143,500 | $1,614,592 |
| July 2025 | $320,433 | $142,031 | $1,615,277 |
| August 2025 | $319,498 | $141,431 | $1,617,999 |
| September 2025 | $319,002 | $140,748 | $1,626,431 |
| October 2025 | $318,879 | $140,150 | $1,636,962 |
| November 2025 | $319,302 | $139,744 | $1,649,445 |
| December 2025 | $320,003 | $139,306 | $1,658,017 |
| January 2026 | $320,498 | $138,152 | $1,659,503 |
| February 2026 | $320,441 | $136,923 | $1,654,977 |
Prices dropped every month from March through October 2025 — seven straight months of decline. The bottom hit at $318,879 in October. Since then, values have recovered slightly and held near $320,000.
One pattern worth noting: while the median has flattened, the floor keeps dropping. The cheapest ZIP fell from $147,554 in March 2025 to $136,923 in February 2026. Meanwhile, the ceiling climbed from $1,602,477 to $1,654,977. Houston’s price gap is widening. The most expensive areas are gaining value while the most affordable areas lose it.
Is Houston a Good Place to Buy in 2026?
The numbers point to a buyer-friendly market. Prices are down year over year, inventory pressure has eased, and the seven-month decline through 2025 gave buyers more negotiating room than they’ve had in years.
A few factors working in buyers’ favor: the median has stabilized near $320K rather than continuing to fall, which reduces the risk of buying into a slide. Population growth of 4% over four years means underlying demand isn’t going away. And the sheer range of pricing — from $137K to $1.6M — means there’s a price point for almost any budget.
The main headwind is cost of ownership. Texas property taxes add significant monthly expense on top of mortgage payments. At 7% mortgage rates, a median-priced Houston home costs roughly $2,543/month all-in. That’s a lot more than renting.
For buyers with long time horizons and down payments ready, the flat pricing and slight YoY decline create a window. The market isn’t in freefall, but sellers aren’t in command either.
Houston Housing Market Outlook for 2026-2027
The three-month trend from December through February shows near-flat movement: $320,003 to $320,498 to $320,441. The market has traded sideways after recovering from the October 2025 low of $318,879.
If the current pace continues, expect Houston home values to hover in the $318K–$322K range through mid-2026. There’s no momentum suggesting a sharp move in either direction. The seven-month decline has ended, but no strong rebound has taken its place.
The widening gap between the cheapest and most expensive ZIPs suggests a split market ahead. High-end neighborhoods may continue appreciating while entry-level areas face continued pressure. Buyers in the sub-$200K range should watch for further softening.
Similar Markets in TX
If you’re shopping in Houston, these Texas cities offer different price points and growth profiles:
- Katy — A Houston suburb that often attracts buyers looking for newer construction and larger lots west of the city.
- Sugar Land — Another Houston-area suburb in the same metro, popular with families priced out of inner-loop neighborhoods.
- San Antonio — Growing at 6.1% and generally more affordable than Houston for comparable square footage.
- Dallas — Texas’s other major metro, offering a different job market mix and price structure.
- Spring — North Houston suburb that provides an alternative for buyers wanting to stay in the metro area.
Frequently Asked Questions
What is the average home price in Houston?
The average home price in Houston is $320,441 as of February 2026. This represents the typical home value across the city’s 97 ZIP codes, where prices range from $136,923 to $1,654,977.
Are home prices going up or down in Houston?
Down. Houston home values declined 1.4% year over year. Prices fell for seven consecutive months from March through October 2025 before stabilizing near $320,000 in the final months of the year.
Is it cheaper to rent or buy in Houston?
Renting is cheaper month-to-month for most areas. Typical rents run $1,300–$1,700, while buying at the median price costs roughly $2,543/month when you include the mortgage, property taxes, and insurance. Texas’s high property tax rates widen this gap significantly.
What is the most affordable neighborhood in Houston?
ZIP code 77054 is the most affordable at $136,923 — less than half the city median. Other budget-friendly options include 77033 at $141,250 and 77026 at $142,240.
Methodology
Home values are based on the Zillow Home Value Index (ZHVI), a smoothed measure of typical home values in the 35th to 65th percentile range. Rent estimates use the Zillow Observed Rent Index (ZORI). Population figures come from the U.S. Census Bureau Population Estimates Program (2020-2024 vintage). All datasets are publicly available. Housing data updated 2026-02-28.