Katy Home Prices: $368K, Down 2.5% — 4 ZIPs Analyzed (2026)
Prices dropped for the 12th straight month in Katy. The median home now sits at $368,357 — down 2.5% from a year ago. That’s a loss of roughly $9,300 in value over twelve months, and the slide hasn’t shown signs of reversing.
Quick answer: The average home price in Katy, TX is $368,357 as of February 2026, down 2.5% year over year according to Zillow.
Current Home Prices in Katy
Here’s a snapshot of where the Katy housing market stands right now.
| Metric | Value |
|---|---|
| Median Home Value | $368,357 |
| Year-over-Year Change | -2.5% |
| Lowest Recorded Value | $270,127 |
| Highest Recorded Value | $483,256 |
| Number of ZIP Codes Tracked | 4 |
| Data as of | February 2026 |
The $368,357 median represents the typical home in the 35th to 65th percentile range. That means half of Katy homes fall above this mark and half below. The spread between the cheapest and most expensive areas is over $213,000, so where you buy within Katy matters a great deal.
A year ago, the median sat at roughly $377,800. The 2.5% decline translates to about $775 lost in value per month. For homeowners who bought at the 2025 peak, that’s real money off the table.
Katy remains part of the larger Houston-The Woodlands-Sugar Land metro area. Compared to the broader Houston market, Katy prices tend to run higher due to its school district reputation and newer housing stock. But the correction has hit Katy harder than some neighboring communities.
Katy Home Prices by Neighborhood
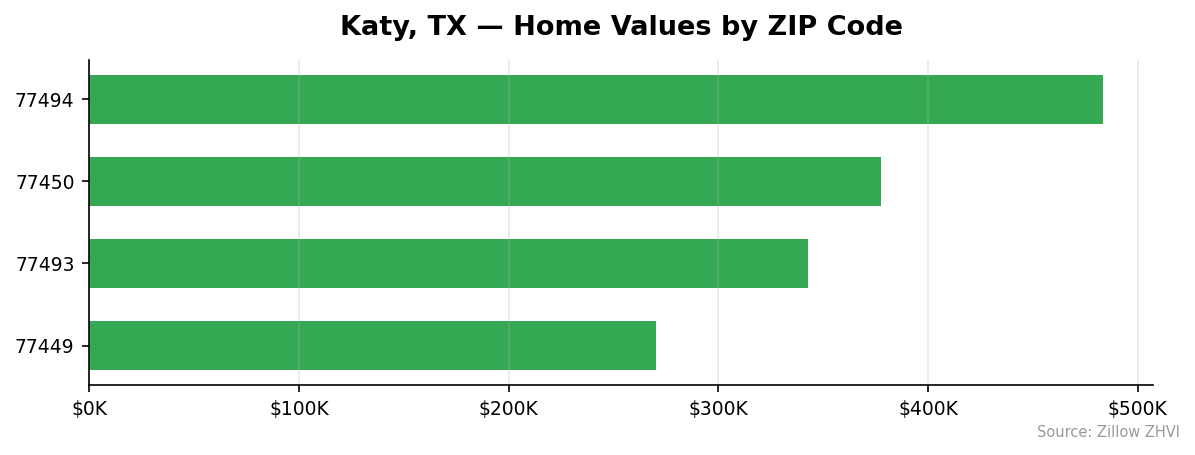
Prices vary dramatically across Katy’s four tracked ZIP codes.
| ZIP Code | Median Home Value | Monthly Rent |
|---|---|---|
| 77494 | $483,256 | $1,754 |
| 77450 | $377,483 | $1,710 |
| 77493 | $342,563 | $2,147 |
| 77449 | $270,127 | $1,805 |
Most Expensive
77494 tops the list at $483,256 — 31% above the city median and nearly double the cheapest ZIP. Despite the high home values, rents here are actually moderate at $1,754 per month, suggesting strong owner-occupancy rates.
77450 comes in second at $377,483, sitting just above the city average. It also carries the lowest rents in Katy at $1,710 per month.
Most Affordable
77449 is the clear entry point into the Katy market at $270,127 — 27% below the city median. Rents here run $1,805 per month, which is actually higher than in the pricier 77494 and 77450 areas.
77493 offers the second most affordable home prices at $342,563 but carries the highest rents in Katy at $2,147 per month. That rent-to-price ratio makes it an interesting area for investors.
One oddity in the data: 77493 has the highest rents but the second-lowest home prices. If you’re a renter in that ZIP, buying might make more financial sense than in other parts of Katy.
Rent vs Buy in Katy
Here’s how the monthly costs break down for a typical Katy home.
| ZIP Code | Monthly Rent | Est. Mortgage Payment* | Difference |
|---|---|---|---|
| 77494 | $1,754 | $2,570 | +$816 |
| 77450 | $1,710 | $2,007 | +$297 |
| 77493 | $2,147 | $1,821 | -$326 |
| 77449 | $1,805 | $1,436 | -$369 |
*Estimated mortgage assumes 20% down, 7% interest rate, 30-year fixed. Principal and interest only — does not include taxes, insurance, or HOA.
The picture is split. In the two most expensive ZIPs (77494 and 77450), renting is cheaper on a pure monthly basis. In the two most affordable ZIPs (77493 and 77449), buying actually costs less than renting each month.
If you’re looking at 77449, the math is hard to ignore. A mortgage runs about $369 less than rent, and you’re building equity. In 77493, buying saves you $326 a month compared to renting.
The city-wide average rent across all four ZIPs is approximately $1,854 per month. A mortgage on the median-priced home ($368,357) runs about $1,960 per month — just $106 more than renting.
Population Growth and Migration
Katy is one of the fastest-growing cities in Texas. The numbers tell the story clearly.
| Year | Population |
|---|---|
| 2020 | 22,419 |
| 2021 | 23,768 |
| 2022 | 25,351 |
| 2023 | 26,609 |
| 2024 | 27,741 |
From 2020 to 2024, Katy added 5,322 residents — a 23.7% increase in four years. That dwarfs the growth rate of every major Texas city.
| City | 2024 Population | 4-Year Growth |
|---|---|---|
| Katy | 27,741 | 23.7% |
| Fort Worth | 1,008,106 | 9.1% |
| San Antonio | 1,526,656 | 6.1% |
| Lubbock | 272,086 | 5.4% |
| Houston | 2,390,125 | 4.0% |
| Austin | 993,588 | 2.9% |
Katy’s growth rate is nearly three times Fort Worth’s and six times Houston’s. That kind of population pressure typically supports housing demand, which makes the current price decline noteworthy. New construction in the area may be absorbing some of that demand before it hits the resale market.
Katy Housing Market Trends
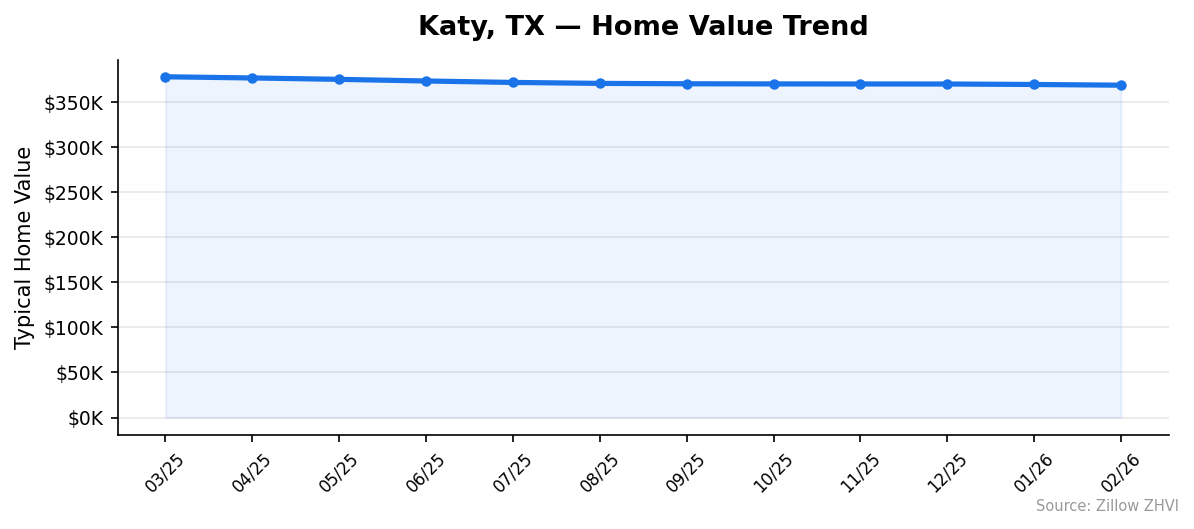
Here’s how prices have moved month by month over the past year.
| Month | Median Home Value | Change from Prior Month |
|---|---|---|
| Mar 2025 | $377,663 | — |
| Apr 2025 | $376,370 | -$1,293 |
| May 2025 | $374,835 | -$1,535 |
| Jun 2025 | $373,006 | -$1,829 |
| Jul 2025 | $371,412 | -$1,594 |
| Aug 2025 | $370,354 | -$1,058 |
| Sep 2025 | $369,924 | -$430 |
| Oct 2025 | $369,764 | -$160 |
| Nov 2025 | $369,704 | -$60 |
| Dec 2025 | $369,665 | -$39 |
| Jan 2026 | $369,138 | -$527 |
| Feb 2026 | $368,357 | -$781 |
Every single month shows a decline. But the pace of the drop matters. From March to June 2025, prices fell by about $1,500 per month. By the fall, the decline slowed to near zero — just $39 between November and December.
Then January and February brought renewed declines. The $781 drop in February is the steepest since August. That’s worth watching. What looked like a stabilization in late 2025 may have been seasonal rather than structural.
Over the full 12-month period, the median fell $9,306 — an average of $776 per month.
Is Katy a Good Place to Buy in 2026?
The data points in two directions at once.
On the buyer’s side: prices are down, and they’ve been falling for a full year. If you’ve been waiting for a dip, this is it. The 2.5% decline means a home that cost $377,000 a year ago now costs $368,000. On a 30-year mortgage, that saves you about $50 per month.
Working against buyers: population growth is strong at 23.7% over four years. That kind of demand doesn’t disappear. Katy’s school district remains a draw, and the Houston metro economy continues to add jobs.
For renters in the 77449 and 77493 ZIP codes, buying is already cheaper than renting on a monthly basis. That’s a straightforward case to make the switch.
For those eyeing the pricier 77494 area, you’re paying a premium — $483,256 median — but rents there are relatively low at $1,754. That signals a neighborhood where people buy and stay.
The current market favors patient buyers. Prices are softening, inventory is likely rising, and sellers are negotiating.
Katy Housing Market Outlook for 2026-2027
The 12-month trend tells a clear story: prices are declining, but the rate of decline fluctuates.
The fall 2025 slowdown (October through December saw drops of just $60 to $160 per month) suggested the market was finding a floor. But January and February 2026 showed the decline picking back up, with $527 and $781 drops respectively.
If the current pace continues, the median could drift toward $360,000 to $365,000 by mid-2026. The three-month trend from December through February shows an average decline of about $450 per month.
Spring and summer traditionally bring more buyer activity, which could slow or pause the decline. But the year-over-year comparison will remain negative for several more months at minimum, given where prices stood in mid-2025.
The strong population growth — over 1,300 new residents per year — provides a floor. A market with that much in-migration is unlikely to see a dramatic crash. A continued slow grind lower, followed by stabilization in late 2026, fits the pattern in the data.
Similar Markets in TX
If you’re exploring options beyond Katy, several Texas markets offer different price points and conditions.
- Houston — The big city next door, with far more inventory and a wider price range than Katy.
- Sugar Land — Another Houston suburb with a similar school-district draw and comparable price tier.
- Spring — North of Houston, Spring offers an alternative suburban market for buyers priced out of Katy.
- Dallas — For those open to a different metro entirely, Dallas provides a larger job market with its own price dynamics.
- Fort Worth — Growing fast at 9.1% and offers a different feel from the Houston suburbs.
Frequently Asked Questions
What is the average home price in Katy?
The average home price in Katy, TX is $368,357 as of February 2026. Prices across the city range from $270,127 in the 77449 ZIP code to $483,256 in 77494. The city-wide median has fallen 2.5% over the past year.
Are home prices going up or down in Katy?
Prices are going down. The median has declined every month for the past 12 months, falling from $377,663 in March 2025 to $368,357 in February 2026. That’s a 2.5% year-over-year drop, representing about $9,300 in lost value.
Is it cheaper to rent or buy in Katy?
It depends on the neighborhood. In 77449 and 77493, buying is cheaper than renting by $326 to $369 per month (assuming 20% down at 7% interest). In the pricier 77494 area, renting saves you about $816 per month compared to a mortgage. City-wide, the average rent of $1,854 is about $106 less than the estimated mortgage on a median-priced home.
What is the most affordable neighborhood in Katy?
ZIP code 77449 is Katy’s most affordable area with a median home value of $270,127 — 27% below the city-wide median. Monthly rent in the area runs $1,805, which is actually higher than the estimated mortgage payment of $1,436, making it a strong candidate for buying over renting.
Is Katy growing or shrinking?
Katy is growing rapidly. The population increased 23.7% from 22,419 in 2020 to 27,741 in 2024. That growth rate is nearly three times faster than Fort Worth and six times faster than Houston. Katy adds roughly 1,300 new residents per year.
Methodology
Home values are based on the Zillow Home Value Index (ZHVI), a smoothed measure of typical home values in the 35th to 65th percentile range. Rent estimates use the Zillow Observed Rent Index (ZORI). Population figures come from the U.S. Census Bureau Population Estimates Program (2020-2024 vintage). All datasets are publicly available. Housing data updated 2026-02-28.