Sugar Land Home Prices: $429K, Down 0.6% — 3 ZIPs Analyzed (2026)
$428,929. That’s what a typical home costs in Sugar Land right now — and it’s actually less than it was a year ago.
The Sugar Land housing market has softened slightly in 2026, with the median home value slipping 0.6% compared to last year. For buyers watching this Fort Bend County suburb, the numbers tell a story of a market that’s cooling but not collapsing.
Quick answer: The average home price in Sugar Land, TX is $428,929 as of February 2026, down 0.6% year over year according to Zillow.
Current Home Prices in Sugar Land
Here’s where the market stands as of February 2026:
| Metric | Value |
|---|---|
| Median Home Value | $428,929 |
| Year-over-Year Change | -0.6% |
| Lowest ZIP Median | $323,378 |
| Highest ZIP Median | $536,769 |
| Number of ZIP Codes | 3 |
That 0.6% annual decline translates to roughly $2,700 in lost value over 12 months. Not a crash by any measure, but it marks a shift from the aggressive appreciation Sugar Land saw in prior years.
The spread between the cheapest and most expensive ZIP codes is over $213,000. That’s a wide gap for a city of this size, meaning your experience of the Sugar Land market depends heavily on which neighborhood you’re shopping in.
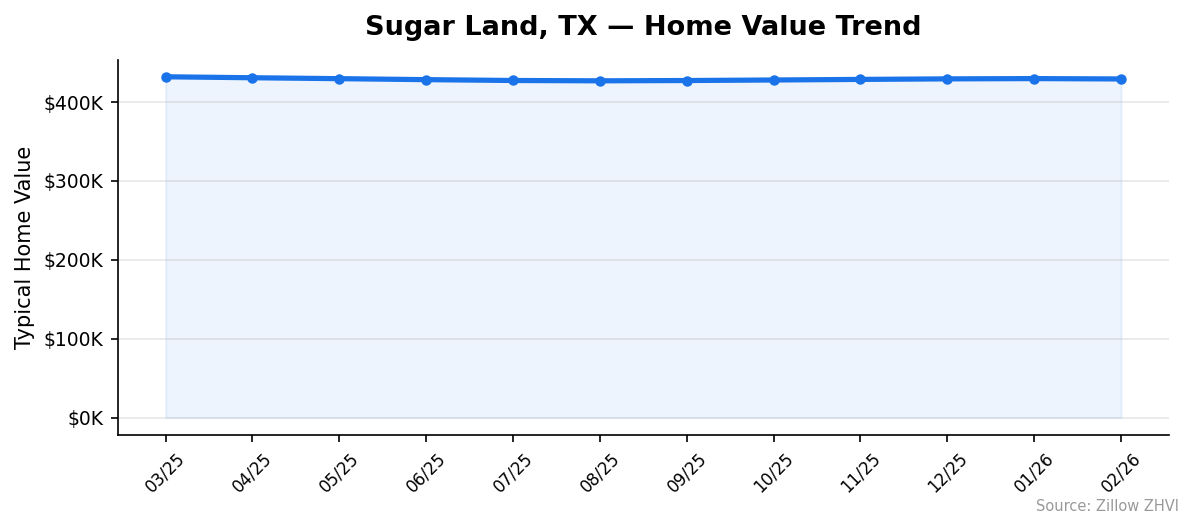
Prices bottomed out in August 2025 at $426,565 and have been ticking upward since. The February reading of $428,929 represents a modest recovery — up about $2,400 from that trough. Whether this rebound has legs is the question every buyer and seller in Sugar Land is asking.
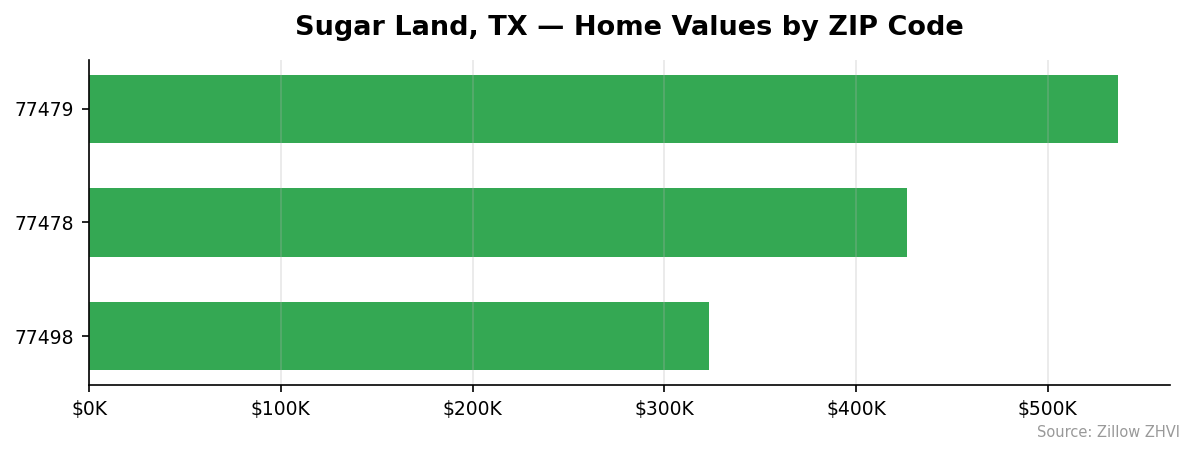
Sugar Land Home Prices by Neighborhood
Sugar Land spans three ZIP codes, each with a distinct price profile:
| ZIP Code | Median Home Value | Median Rent |
|---|---|---|
| 77479 | $536,769 | $2,274/mo |
| 77478 | $426,641 | $1,762/mo |
| 77498 | $323,378 | $1,861/mo |
Most Expensive
77479 commands the highest prices in Sugar Land at $536,769 — roughly 25% above the citywide median. It also carries the highest rents at $2,274 per month, reflecting strong demand for the area.
Most Affordable
77498 comes in at $323,378, about 25% below the city average. Interestingly, its rent of $1,861 per month sits in the middle of the pack, which could make it attractive for investors looking at rent-to-price ratios.
77478 lands almost exactly at the citywide median of $426,641. Its rent of $1,762 is actually the lowest in Sugar Land, making it the most affordable neighborhood for renters.
Rent vs Buy in Sugar Land
Rent ranges from $1,762 to $2,274 per month across Sugar Land’s three ZIP codes. How does that compare to buying?
A conventional mortgage on a $428,929 home with 20% down ($85,786) leaves a loan balance of $343,143. At a 6.5% rate on a 30-year fixed mortgage, the principal and interest payment alone runs about $2,169 per month. Add property taxes (Fort Bend County rates are among the highest in Texas) and homeowner’s insurance, and you’re looking at roughly $3,000–$3,300 per month in total housing costs.
| ZIP Code | Monthly Rent | Est. Mortgage (P&I only) |
|---|---|---|
| 77479 | $2,274 | ~$2,715 |
| 77478 | $1,762 | ~$2,158 |
| 77498 | $1,861 | ~$1,636 |
In 77498, the math gets interesting. The estimated mortgage payment on its lower-priced homes is actually close to rent, making buying more competitive there. In 77479, renting saves you at least $400–$500 per month before taxes and insurance — a significant gap.
The rent vs buy decision in Sugar Land depends on your ZIP code, your down payment, and how long you plan to stay. With prices flat to slightly declining, the urgency to buy before being “priced out” has faded.
Population Growth and Migration
Sugar Land’s population has been essentially flat — and slightly shrinking.
| Year | Population |
|---|---|
| 2020 | 110,844 |
| 2021 | 109,683 |
| 2022 | 110,001 |
| 2023 | 109,801 |
| 2024 | 109,851 |
The city lost about 993 residents between 2020 and 2024, a decline of 0.9%. That’s a contrast to many other Texas cities that are growing rapidly:
| City | 2024 Population | 4-Year Growth |
|---|---|---|
| Fort Worth | 1,008,106 | +9.1% |
| San Antonio | 1,526,656 | +6.1% |
| Lubbock | 272,086 | +5.4% |
| Houston | 2,390,125 | +4.0% |
| Austin | 993,588 | +2.9% |
While Houston added 4% more residents, its suburb Sugar Land couldn’t keep pace. A flat or declining population typically eases housing demand. This is one factor behind the gentle price softening — fewer new residents competing for the same housing stock.
Sugar Land Housing Market Trends
Here’s how the median home value moved month by month over the past year:
| Month | Median Value | Change from Prior Month |
|---|---|---|
| Mar 2025 | $431,674 | — |
| Apr 2025 | $430,464 | -$1,210 |
| May 2025 | $429,301 | -$1,163 |
| Jun 2025 | $428,049 | -$1,252 |
| Jul 2025 | $426,986 | -$1,063 |
| Aug 2025 | $426,565 | -$421 |
| Sep 2025 | $426,938 | +$373 |
| Oct 2025 | $427,611 | +$673 |
| Nov 2025 | $428,353 | +$742 |
| Dec 2025 | $429,041 | +$688 |
| Jan 2026 | $429,389 | +$348 |
| Feb 2026 | $428,929 | -$460 |
The pattern is clear. Prices slid from March through August 2025, losing about $5,100 over five months. Then a slow recovery started in September, clawing back most of those losses by January 2026.
February’s slight dip of $460 breaks the recovery streak. It could be seasonal — winter months typically see less buyer activity — or it could signal the recovery is running out of steam.
Is Sugar Land a Good Place to Buy in 2026?
The data points to a balanced market leaning slightly toward buyers.
Prices are down 0.6% year over year. Population is flat. And the price recovery that started last fall appears to be stalling. For buyers, this means less competition and more negotiating room than in years past.
Sugar Land still carries a price premium over many Houston-area suburbs. At $429K, you’re paying for highly rated schools, master-planned communities, and proximity to the Texas Medical Center and Energy Corridor.
If you’re buying in 77498, you can get into the market under $325K — a rare find for Sugar Land. If 77479 is your target, be prepared for $537K median values with rents that partially offset ownership costs for investors.
The risk? Further price declines if population continues to stagnate. The reward? Buying in a stable, established suburb at a slight discount to last year.
Sugar Land Housing Market Outlook for 2026-2027
The 12-month trend shows a market that fell, recovered, and may be plateauing.
From September 2025 through January 2026, prices rose $2,451 — a pace of about $490 per month. February interrupted that climb with a small drop. If the current pace of recovery resumes through spring (historically the strongest buying season), the median could push back toward $431K–$432K by mid-2026.
If the February dip marks a new direction instead of a seasonal blip, prices may hover in the $427K–$430K range through the rest of the year. The flat population growth doesn’t provide the demand pressure needed for significant appreciation.
The most likely scenario based on the data: Sugar Land prices stay within a narrow band, neither surging nor falling sharply.
Similar Markets in TX
If you’re exploring the Houston area and beyond, here are comparable Texas markets:
- Katy — Sugar Land’s neighbor to the northwest and another major Fort Bend/Harris County suburb worth comparing side by side.
- Houston — The metro anchor with far more inventory and price diversity across hundreds of ZIP codes.
- Spring — Another Houston suburb on the north side, often offering lower price points.
- Dallas — Texas’s other major metro, useful for comparing appreciation trends across the state.
- Grand Prairie — A mid-priced DFW suburb with a similar suburban feel at a different price point.
Frequently Asked Questions
What is the average home price in Sugar Land?
The average home price in Sugar Land is $428,929 as of February 2026. Prices range from $323,378 in ZIP code 77498 to $536,769 in 77479, so the neighborhood matters as much as the citywide number.
Are home prices going up or down in Sugar Land?
Prices are down 0.6% year over year. After dropping through most of 2025, values recovered slightly in fall and winter before ticking down again in February 2026. The overall direction is flat with a slight downward bias.
Is it cheaper to rent or buy in Sugar Land?
Renting is cheaper in most of Sugar Land. Monthly rents range from $1,762 to $2,274, while a mortgage payment on the median home runs roughly $2,169 in principal and interest alone — before taxes and insurance push total costs above $3,000. The exception is 77498, where lower home prices bring mortgage payments closer to rental rates.
What is the most affordable neighborhood in Sugar Land?
ZIP code 77498 is the most affordable with a median home value of $323,378. That’s about $105,000 less than the citywide median and over $213,000 cheaper than the priciest ZIP code, 77479.
Methodology
Home values are based on the Zillow Home Value Index (ZHVI), a smoothed measure of typical home values in the 35th to 65th percentile range. Rent estimates use the Zillow Observed Rent Index (ZORI). Population figures come from the U.S. Census Bureau Population Estimates Program (2020-2024 vintage). All datasets are publicly available. Housing data updated 2026-02-28.