Lancaster Home Prices: $460K, Down 2.0% — 3 ZIPs Analyzed (2026)
$460,385. That’s what a typical home in Lancaster costs right now — and it’s less than it was a year ago. Prices have slipped 2.0% year over year, bucking the trend in much of Southern California. For buyers priced out of closer-in Los Angeles neighborhoods, Lancaster remains one of the more affordable options in the metro.
Quick answer: The average home price in Lancaster, CA is $460,385 as of February 2026, down 2.0% year over year according to Zillow.
Current Home Prices in Lancaster
| Metric | Value |
|---|---|
| Median home price | $460,385 |
| Year-over-year change | -2.0% |
| Lowest ZIP median | $414,895 |
| Highest ZIP median | $537,473 |
| Number of ZIP codes | 3 |
| Data as of | February 2026 |
Lancaster sits in the Los Angeles-Long Beach-Anaheim metro area, but its prices tell a different story than the coastal cities. The median of $460,385 puts it well below the broader metro’s typical values.
The 2.0% annual decline translates to roughly $9,400 less than what the same home would have cost in early 2025. That’s meaningful for first-time buyers stretching to get into the market. The price range across Lancaster’s three ZIP codes spans about $122,500 — a gap that reflects real neighborhood-level differences in housing stock and location.
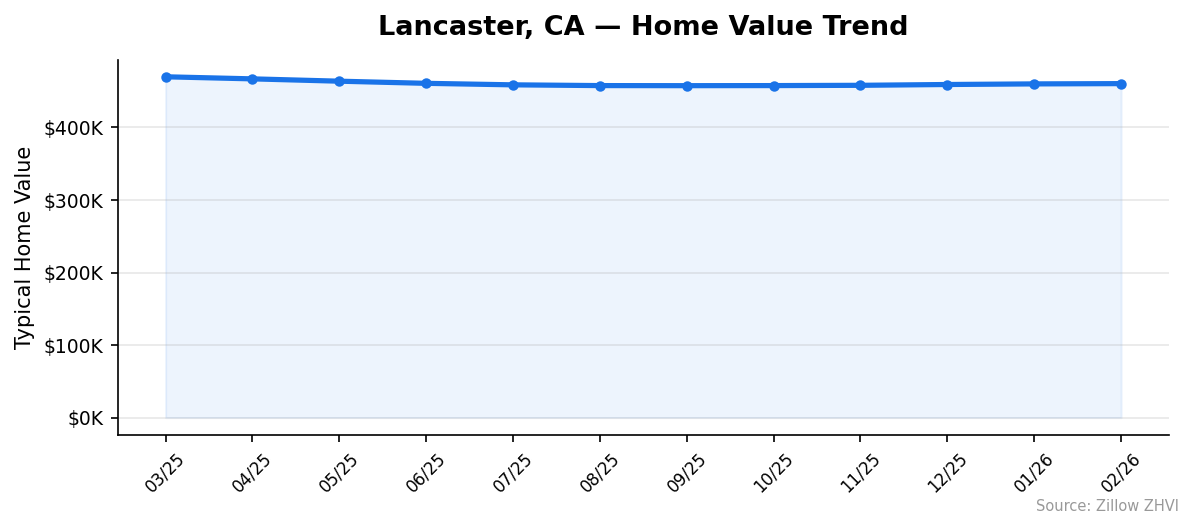
A year ago, Lancaster’s median sat around $469,800. The drop hasn’t been a straight line. Prices fell through the spring and summer of 2025, bottomed out near $457,500 in September, then began a slow climb back. February’s reading of $460,385 sits roughly in the middle of that range.
Lancaster Home Prices by Neighborhood
| ZIP Code | Median Home Value | Average Rent |
|---|---|---|
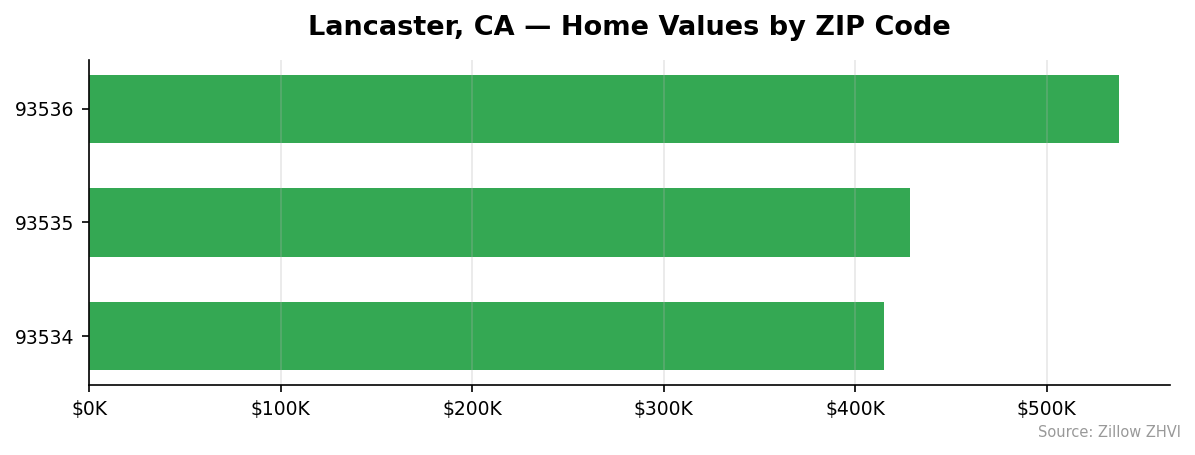
| 93534 | $414,895 | $2,022/mo |
| 93535 | $428,786 | $2,535/mo |
| 93536 | $537,473 | $2,723/mo |
Most Expensive
93536 leads Lancaster at $537,473 — about 17% above the city median. This ZIP also commands the highest rents at $2,723 per month, reflecting stronger demand for its housing stock.
Most Affordable
93534 comes in at $414,895, roughly 10% below the city average. Rents here are also the lowest in Lancaster at $2,022 per month. 93535 sits in the middle at $428,786 with rents of $2,535 — still below the city median but significantly pricier on the rental side than 93534.
The spread between the cheapest and most expensive ZIP is $122,578. That means a buyer choosing 93534 over 93536 saves enough on the purchase price to cover more than five years of property taxes.
Rent vs Buy in Lancaster
Renting and buying in Lancaster cost almost the same each month right now.
| ZIP Code | Monthly Rent | Est. Mortgage Payment* |
|---|---|---|
| 93534 | $2,022 | ~$2,210 |
| 93535 | $2,535 | ~$2,285 |
| 93536 | $2,723 | ~$2,860 |
Estimated mortgage: 20% down, 7% rate, 30-year fixed. Principal and interest only — does not include taxes, insurance, or HOA.
The city-wide average rent is approximately $2,427 per month. A mortgage on the median-priced home ($460,385) with 20% down at 7% runs about $2,450 monthly in principal and interest. The gap is razor-thin.
That near-parity changes the math for renters. In 93534, buying is only about $188 more per month than renting before you account for equity buildup and tax benefits. In 93535, renting is actually more expensive than the estimated mortgage — an unusual situation that makes ownership look like the better deal on paper.
The one catch: that 20% down payment on the median home is $92,077. That’s the real barrier, not the monthly cost.
Population Growth and Migration
Lancaster has been losing residents. The city’s population dropped from 173,192 in 2020 to 167,426 in 2024 — a decline of 3.3% over four years.
| Year | Population |
|---|---|
| 2020 | 173,192 |
| 2021 | 170,036 |
| 2022 | 167,893 |
| 2023 | 167,293 |
| 2024 | 167,426 |
The sharpest drop came between 2020 and 2021, when the city lost over 3,100 people. The decline slowed significantly after that, and 2024 actually showed a tiny uptick of 133 residents over 2023. The bleeding may have stopped.
Compare that to other California cities:
| City | 2024 Population | 4-Year Growth |
|---|---|---|
| Bakersfield | 417,468 | +3.0% |
| Sacramento | 535,798 | +1.9% |
| San Diego | 1,404,452 | +1.4% |
| Fresno | 550,105 | +1.4% |
| Oakland | 443,554 | +0.6% |
| Lancaster | 167,426 | -3.3% |
Lancaster is the only city in this comparison losing population. Bakersfield — another Inland California city with similar price points — grew 3.0% in the same period. That population pressure likely explains why Bakersfield’s prices haven’t softened the way Lancaster’s have.
Fewer residents means softer housing demand. That’s one factor behind the 2.0% price decline.
Lancaster Housing Market Trends
Here’s how prices moved month by month over the past year:
| Month | Average Price | Low | High |
|---|---|---|---|
| Mar 2025 | $469,809 | $424,802 | $545,127 |
| Apr 2025 | $466,943 | $421,818 | $542,147 |
| May 2025 | $463,745 | $418,673 | $538,544 |
| Jun 2025 | $460,786 | $415,836 | $535,195 |
| Jul 2025 | $458,708 | $413,885 | $532,820 |
| Aug 2025 | $457,680 | $413,036 | $531,572 |
| Sep 2025 | $457,564 | $412,877 | $531,565 |
| Oct 2025 | $457,682 | $412,716 | $532,219 |
| Nov 2025 | $458,056 | $412,798 | $533,450 |
| Dec 2025 | $459,175 | $413,758 | $535,363 |
| Jan 2026 | $460,008 | $414,594 | $536,687 |
| Feb 2026 | $460,385 | $414,895 | $537,473 |
The pattern is clear. Prices fell steadily from March through September 2025, losing about $12,200 over six months. Then the trend reversed. Since October, prices have climbed back by roughly $2,800.
September 2025 marked the floor at $457,564. The recovery has been slow — just $2,821 over five months. At this pace, it will take well into 2027 before prices return to their March 2025 level of $469,809.
One detail worth watching: the price range between the cheapest and most expensive ZIP codes has been widening slightly. In September, the gap was $118,688. By February, it grew to $122,578. The pricier areas are recovering faster.
Is Lancaster a Good Place to Buy in 2026?
The numbers lean toward buyers right now.
Prices are down 2.0% year over year. Population is declining. Monthly costs for buying and renting are nearly identical. That combination gives buyers more negotiating room than they’ve had in years.
Lancaster’s position in the LA metro matters. You’re about 70 miles north of downtown Los Angeles, and the price difference is enormous. The trade-off is commute time, but for remote workers or those employed locally in aerospace and logistics, the math works.
The recent price stabilization since September 2025 suggests the market isn’t in freefall. Values dropped, found a floor, and started a modest recovery. If you’re buying to hold for five-plus years, the entry point is better now than it was a year ago.
Risk factors: continued population loss could keep a lid on appreciation, and the city’s distance from employment centers limits demand from traditional LA commuters.
Lancaster Housing Market Outlook for 2026-2027
The three-month trend from December 2025 through February 2026 shows prices rising at about $400 per month. That’s not dramatic growth — it’s more of a slow grind upward after the mid-2025 correction.
If the current pace continues, Lancaster’s median could reach the $463,000-$465,000 range by mid-2026. That would still leave prices below where they were in spring 2025.
The stabilizing population numbers from 2023 to 2024 could provide a modest tailwind. If outmigration has genuinely slowed, the housing market loses one of its headwinds.
Don’t expect a sharp rebound. The data points to a market that’s slowly healing, not one about to surge. Buyers who get in during 2026 will likely see modest appreciation, not rapid gains.
Similar Markets in CA
If you’re exploring Lancaster, these California cities offer useful comparisons:
- Bakersfield — another inland California city with affordable prices and a growing population, unlike Lancaster’s decline.
- Fontana — closer to the Inland Empire job centers, offering a different commute trade-off than Lancaster.
- Riverside — a larger market in the IE with more housing variety and employment options.
- Fresno — Central Valley pricing with a growing population of 550,105, well ahead of Lancaster’s trajectory.
- Oxnard — coastal Ventura County option for buyers willing to pay more for proximity to the beach.
Frequently Asked Questions
What is the average home price in Lancaster?
The average home price in Lancaster, CA is $460,385 as of February 2026. Across the city’s three ZIP codes, prices range from $414,895 in 93534 to $537,473 in 93536. The city-wide median sits well below the broader Los Angeles metro average.
Are home prices going up or down in Lancaster?
Prices are down 2.0% compared to a year ago. The decline played out mainly between March and September 2025, when the median fell from $469,809 to $457,564. Since then, prices have recovered slightly to $460,385 — a partial but not complete rebound.
Is it cheaper to rent or buy in Lancaster?
It’s nearly a wash. The average rent across Lancaster is about $2,427 per month, while a mortgage on the median home with 20% down at 7% costs roughly $2,450 in principal and interest. In ZIP code 93535, renting at $2,535 actually costs more than the estimated mortgage payment of $2,285.
What is the most affordable neighborhood in Lancaster?
ZIP code 93534 is the most affordable area with a median home value of $414,895 — about $45,500 below the city average. Rents here are also the cheapest at $2,022 per month. It’s roughly $122,500 less expensive than the priciest ZIP, 93536.
Methodology
Home values are based on the Zillow Home Value Index (ZHVI), a smoothed measure of typical home values in the 35th to 65th percentile range. Rent estimates use the Zillow Observed Rent Index (ZORI). Population figures come from the U.S. Census Bureau Population Estimates Program (2020-2024 vintage). All datasets are publicly available. Housing data updated 2026-02-28.