Manchester Home Prices: $434K, Up 1.3% — 5 ZIPs Analyzed (2026)
$434K. That’s what a typical Manchester home cost in February 2026 — up 1.3% from a year ago. The market keeps grinding higher in small monthly steps, with no sign of the price drops hitting larger New England metros.
Quick answer: The average home price in Manchester, NH is $433,572 as of February 2026, up 1.3% year over year according to Zillow.
Current Home Prices in Manchester
The Manchester housing market is grinding, not surging. Year-over-year growth of 1.3% trails inflation. But unlike Boston suburbs that have flatlined or dropped, Manchester is still posting positive monthly gains.
Here’s where the city stands as of February 2026:
| Metric | Value |
|---|---|
| Median home value | $433,572 |
| Year-over-year change | +1.3% |
| Cheapest ZIP | $407,990 (03103) |
| Most expensive ZIP | $466,952 (03104) |
| Spread between ZIPs | $58,962 |
| ZIPs covered | 5 |
The $59K gap between the cheapest and priciest ZIPs is narrow. In bigger metros that spread runs into the hundreds of thousands. In Manchester, every ZIP sits within 8% of the citywide median.
That compression matters for buyers. You can’t really shop your way to a major discount by changing neighborhoods — the cheapest ZIP is only about 6% under the median, and the priciest is about 8% over. Your budget mostly determines what condition and size you can buy, not where.
The 1.3% appreciation works out to roughly $5,700 added to a typical home’s value over 12 months. For a buyer trying to time the market, that’s barely the cost of two months of rent.
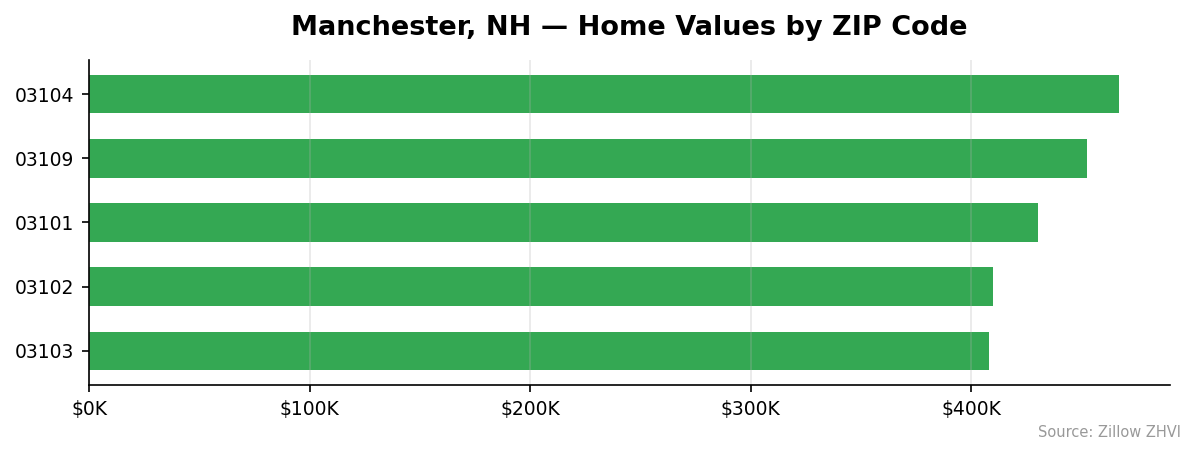
Manchester Home Prices by Neighborhood
Manchester’s five residential ZIPs split cleanly into two tiers. The west and south sides come in below the city median. The north side, downtown, and the east side trend higher.
| ZIP | Area | Median Value | Avg Rent |
|---|---|---|---|
| 03104 | North side | $466,952 | $1,841 |
| 03109 | East side | $452,499 | — |
| 03101 | Downtown / central | $430,494 | $2,266 |
| 03102 | West side | $409,927 | $2,008 |
| 03103 | South side | $407,990 | $1,838 |
Most Expensive
03104 ($466,952) — The north side carries the city’s highest home values, sitting about 8% above the citywide median. Despite the higher home prices, rents here run on the low end at $1,841.
03109 ($452,499) — The east side, separated from the rest of the city by the Merrymeeting River corridor, runs about 4% above the median. Rent data isn’t available for this ZIP.
03101 ($430,494) — Downtown and the central core land just under the citywide median for sale prices. Rents are the highest in the city at $2,266 — a sign that downtown rentals command a premium even when sale prices don’t.
Most Affordable
03103 ($407,990) — The south side is Manchester’s cheapest ZIP. Median values run 6% below the citywide figure, and rents are the lowest in the city at $1,838.
03102 ($409,927) — The west side sits just $1,937 above 03103. You’re looking at virtually identical sale prices but $170 more in monthly rent.
03101 ($430,494) — Downtown rounds out the bottom three for sale prices despite the high rents — a buy-vs-rent gap worth noting.
Rent vs Buy in Manchester
Average rent across Manchester’s four ZIPs with rent data: $1,988 a month. Now run the math on buying.
A median-priced home at $433,572 with 20% down ($86,714) leaves a $346,858 mortgage. At a 7% rate over 30 years, that’s roughly $2,308 a month in principal and interest. Add property tax — New Hampshire averages around 1.5% of assessed value, or about $542 a month here — plus homeowners insurance at maybe $130 a month.
Total monthly cost of ownership: about $2,980, before maintenance.
| Cost | Renting | Buying |
|---|---|---|
| Monthly payment | $1,988 | $2,980 |
| Upfront cost | ~$4,000 (deposit + first month) | $86,714 (down payment) |
| 12-month outlay | $23,856 | ~$35,760 + closing costs |
Renting beats buying on monthly cash flow by nearly $1,000 a month right now. You’d also keep $87K in your pocket instead of locking it into home equity.
The buy case rests on appreciation. At the current 1.3% annual pace, your $434K home gains about $5,640 in value per year. That’s well below the $12K extra you’re paying versus renting. The math only flips if appreciation accelerates or rates drop enough to refinance.
For people who want stability and don’t mind paying a premium for it, buying still makes sense. For anyone optimizing pure cost, renting wins by a wide margin in early 2026.
Population Growth and Migration
Manchester is growing — slowly, but consistently. The Census Bureau pegs the population at 116,386 in 2024, up from 115,512 in 2020. That’s 874 additional residents over four years, or 0.8% growth.
Year-by-year:
| Year | Population |
|---|---|
| 2020 | 115,512 |
| 2021 | 115,140 |
| 2022 | 115,454 |
| 2023 | 115,692 |
| 2024 | 116,386 |
The city dipped in 2021, then recovered. The 2024 number is the highest of the five-year window, suggesting the recent trend is positive rather than reverting.
How does that compare to other New Hampshire cities?
| City | 2024 Population | 4-Year Growth |
|---|---|---|
| Manchester | 116,386 | +0.8% |
| Nashua | 91,851 | +0.7% |
Both of New Hampshire’s largest cities are growing at nearly identical paces. That parity is unusual — typically you’d see a stronger pull toward one or the other. Instead, southern New Hampshire is absorbing population evenly across its two anchor cities.
Steady but slow population growth is consistent with the steady but slow home price appreciation. Demand isn’t collapsing. It also isn’t surging. That’s why prices grind sideways-up at 1.3% rather than spiking or falling.
Manchester Housing Market Trends
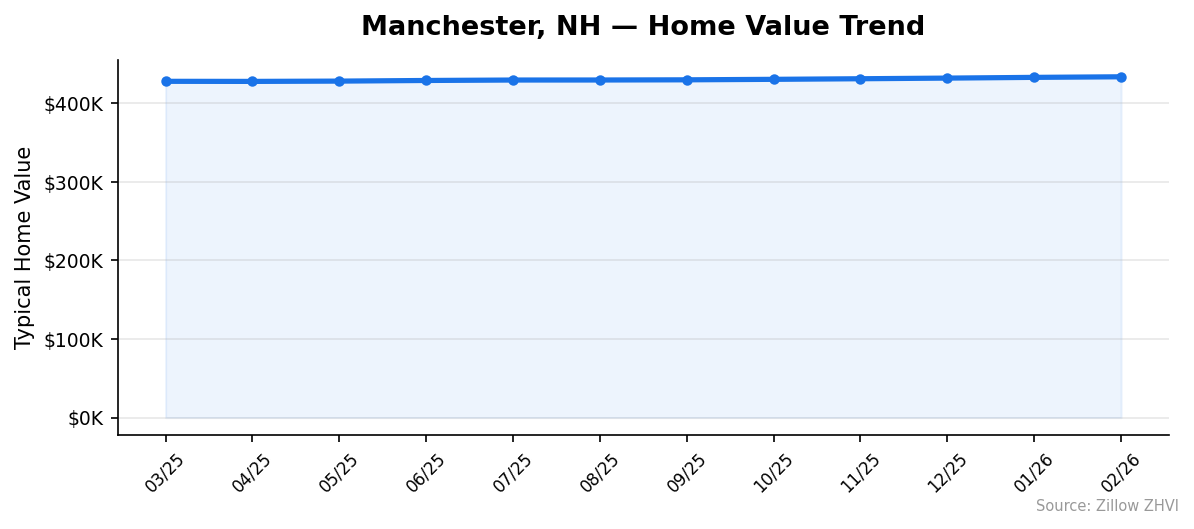
The 12-month trend shows almost monotonic price growth. Only one month — April 2025 — posted a tiny decline before the climb resumed.
| Month | Median |
|---|---|
| Mar 2025 | $427,808 |
| Apr 2025 | $427,703 |
| May 2025 | $428,072 |
| Jun 2025 | $428,880 |
| Jul 2025 | $429,445 |
| Aug 2025 | $429,483 |
| Sep 2025 | $429,715 |
| Oct 2025 | $430,338 |
| Nov 2025 | $431,088 |
| Dec 2025 | $431,898 |
| Jan 2026 | $432,833 |
| Feb 2026 | $433,572 |
Total gain over 12 months: $5,764, or 1.3%.
Look at the monthly cadence and you can see the market accelerating slightly into winter. The November-to-February stretch added $2,484 — about 43% of the entire year’s gains compressed into four months. That’s the opposite of what most metros are showing, where winter typically dampens prices.
For sellers, that late-cycle strength matters. Manchester homes weren’t sitting on the market waiting for spring buyers. They were transacting at higher prices through the slow season.
For buyers, the takeaway is less encouraging: there’s no obvious soft window. The market hasn’t given up ground at any point in the last year.
Is Manchester a Good Place to Buy in 2026?
The data points to a balanced market leaning slightly toward sellers. Prices are rising, inventory pressure isn’t crushing values, and population growth supports continued demand.
But the price-to-rent math complicates the buy case for individual purchasers. At a roughly $1,000 monthly premium over renting, ownership only pays off if you stay long enough to amortize closing costs against modest 1.3% annual appreciation — meaning at least 5 to 7 years.
What works in Manchester right now:
- Buyers with cash who can avoid mortgage interest
- Long-horizon buyers planning to stay 7+ years
- Owners trading up within the city (selling and buying both move with the market)
What doesn’t:
- Buyers stretching their budget assuming aggressive appreciation
- Investors looking for cash-flow positive rentals at current prices
- Short-timers who’d be better off renting
Manchester isn’t a screaming deal. It also isn’t overheating. It’s a steady, mid-priced New England market where you can buy without overpaying — if your timeline is long enough.
Manchester Housing Market Outlook for 2026-2027
The 3-month trend (December through February) added $1,674 to the median. Annualized, that pace works out to roughly 1.5% — slightly faster than the 12-month figure of 1.3%.
If the current pace continues, Manchester home prices would land somewhere around $440K by mid-2026 and approach $445K by year-end. That’s a directional read, not a forecast.
What could change the trajectory:
- A meaningful drop in mortgage rates would pull more demand off the sidelines and likely accelerate prices
- A regional employment shock, particularly in healthcare or manufacturing, would pressure prices the other way
- Continued population growth around 0.8% annually keeps baseline demand intact
The 12-month chart shows no inflection point. No month broke the trend. Until something disrupts that pattern, the most likely scenario is more of the same: small, steady monthly gains.
Similar Markets in NH
If Manchester’s price point or market dynamics don’t fit, these nearby New Hampshire cities offer alternatives:
- Nashua — Manchester’s southern neighbor and the second-largest city in the state, with similar population growth.
- Rochester — A smaller city in the eastern part of the state, often priced below Manchester.
- Haverhill — A rural North Country option that contrasts sharply with the southern New Hampshire markets.
- Ossipee — A Lakes Region community for buyers prioritizing geography over urban amenities.
Frequently Asked Questions
What is the average home price in Manchester?
The average home price in Manchester, NH is $433,572 as of February 2026. The figure reflects the typical mid-tier home across the city’s five ZIP codes, ranging from $407,990 in 03103 to $466,952 in 03104.
Are home prices going up or down in Manchester?
Prices are up 1.3% year over year — a gain of $5,764 on a typical home. The market has posted positive monthly gains in 11 of the past 12 months, with the December-through-February stretch delivering the strongest momentum.
Is it cheaper to rent or buy in Manchester?
Renting is cheaper by about $1,000 a month at current prices and rates. The average rent across Manchester ZIPs is $1,988, while a median-priced home with 20% down works out to roughly $2,980 a month after taxes and insurance. The buy case strengthens for buyers with longer time horizons or larger down payments.
What is the most affordable neighborhood in Manchester?
ZIP 03103 on the south side is the cheapest at $407,990 — about 6% below the citywide median. Rents there are also the lowest in the city at $1,838 a month, making it a low-cost option for both buyers and renters.
Methodology
Home values are based on the Zillow Home Value Index (ZHVI), a smoothed measure of typical home values in the 35th to 65th percentile range. Rent estimates use the Zillow Observed Rent Index (ZORI). Population figures come from the U.S. Census Bureau Population Estimates Program (2020-2024 vintage). All datasets are publicly available. Housing data updated 2026-02-28.