Bethlehem Home Prices: $338K, Up 2.9% — 4 ZIPs Analyzed (2026)
$338,031. That’s what a typical home costs in Bethlehem as of February 2026. Prices climbed 2.9% over the past year, and the market has posted gains every single month for a full year.
Quick answer: The average home price in Bethlehem, PA is $338,031 as of February 2026, up 2.9% year over year according to Zillow.
Current Home Prices in Bethlehem
The typical Bethlehem home sells for $338,031. That figure sits in the middle of a wide range — anywhere from $279,871 in the cheapest ZIP to $413,104 in the priciest, a gap of more than $133,000.
| Metric | Value |
|---|---|
| Median home value | $338,031 |
| Year-over-year change | +2.9% |
| Cheapest ZIP | $279,871 (18015) |
| Most expensive ZIP | $413,104 (18020) |
| ZIP codes tracked | 4 |
| Data through | February 2026 |
The 2.9% annual gain puts Bethlehem ahead of inflation but well below the double-digit jumps seen during the pandemic years. For a buyer, that means prices are rising — but slowly enough that you’re not racing the clock the way you would have been in 2021 or 2022.
The city sits inside the Allentown-Bethlehem-Easton metro, which spans parts of Pennsylvania and New Jersey. Bethlehem itself is split between Northampton and Lehigh counties, and the four ZIP codes tracked here cover both halves of the city.
One number worth holding onto: the spread between the cheapest and most expensive ZIPs is roughly 48%. That’s a big variation for a city of under 80,000 people. Where you buy in Bethlehem matters more than the citywide average suggests.
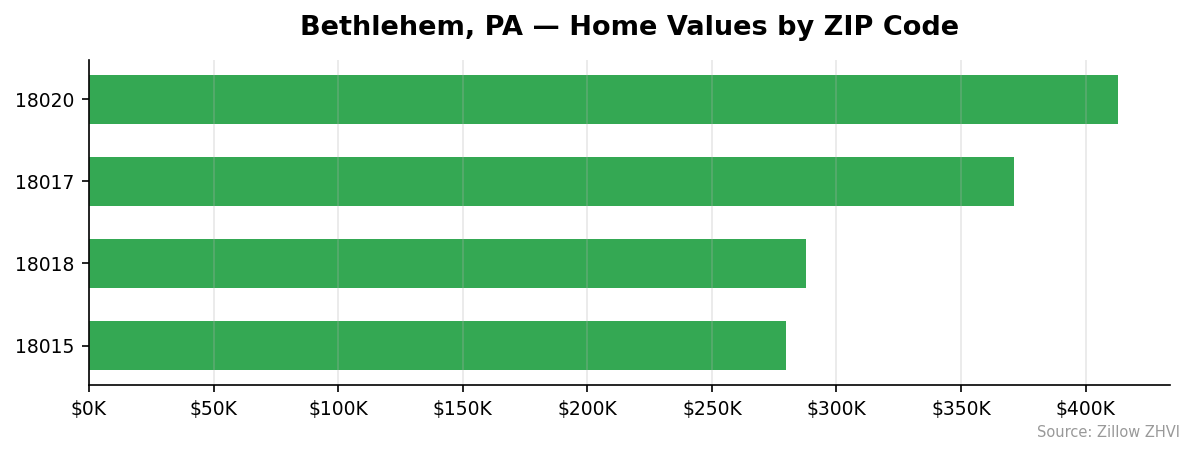
Bethlehem Home Prices by Neighborhood
Four ZIP codes make up Bethlehem proper. Two sit below the city average, and two sit above. The pricing gap between them is the most useful number on this page.
| ZIP | Median Home Value | Median Rent | vs. City Avg |
|---|---|---|---|
| 18020 | $413,104 | — | +22% |
| 18017 | $371,203 | $2,048 | +10% |
| 18018 | $287,947 | $1,733 | -15% |
| 18015 | $279,871 | $1,732 | -17% |
Most Expensive
- 18020 at $413,104 — the priciest ZIP in the city, sitting 22% above the Bethlehem average. No rent data is currently tracked for this area.
- 18017 at $371,203 — a clear step below 18020 but still 10% above the city average. Rent runs $2,048, the highest among the three ZIPs with rent data.
- 18018 at $287,947 — third place by price, but more than $125,000 cheaper than the top spot.
Most Affordable
- 18015 at $279,871 — the cheapest ZIP and the lowest rent at $1,732. If you want a Bethlehem address for the smallest check, this is where the math lands.
- 18018 at $287,947 — a few thousand dollars more than 18015, with nearly identical rent at $1,733.
- 18017 at $371,203 — only “affordable” relative to 18020. It costs over $90,000 more than 18015.
Rent vs Buy in Bethlehem
Three of Bethlehem’s four ZIPs report rent data. The average comes to $1,838 a month — $2,048 in 18017, $1,733 in 18018, and $1,732 in 18015.
Compare that to the cost of buying. On a $338,031 home with 20% down at a 7% mortgage rate, principal and interest run about $1,800 a month. Add property taxes (Pennsylvania averages around 1.5% of home value annually) and insurance, and your monthly carrying cost lands somewhere between $2,200 and $2,400.
That makes renting cheaper today by roughly $400 to $600 a month, even before you count the down payment of about $67,600 you’d need to put down. For a buyer who plans to stay seven or more years, the math eventually flips because mortgage payments build equity while rent doesn’t. For shorter time horizons, renting wins.
The cheapest combination is ZIP 18015. You can rent there for $1,732 or buy for $279,871 — the lowest numbers on both sides of the equation. ZIP 18017 is the priciest to rent at $2,048 and the second-priciest to buy.
One caveat: rent and home values don’t always move together. If rents climb faster than prices over the next year, the rent-vs-buy calculation could shift toward buying.
Population Growth and Migration
Bethlehem is growing — and faster than every other major city in Pennsylvania.
| Year | Population |
|---|---|
| 2020 | 75,706 |
| 2021 | 77,947 |
| 2022 | 77,752 |
| 2023 | 78,835 |
| 2024 | 79,453 |
The city added 3,747 residents between 2020 and 2024, a 4.9% gain. That’s a sharp contrast with the rest of the state.
| City | 2024 Population | 4-Year Growth |
|---|---|---|
| Bethlehem | 79,453 | +4.9% |
| Pittsburgh | 307,668 | +1.6% |
| Allentown | 127,138 | +1.1% |
| Reading | 96,000 | +1.1% |
| Harrisburg | 50,649 | +1.1% |
| Lancaster | 58,441 | +0.9% |
Bethlehem’s growth rate is more than triple the next-fastest city on the list. That kind of demand pressure shows up in housing prices over time — more buyers competing for roughly the same number of homes pushes values up. The 2.9% annual price gain in Bethlehem is consistent with that pattern.
For homeowners, growing population is a tailwind. For first-time buyers, it means the affordability window may be smaller than it looks today.
Bethlehem Housing Market Trends
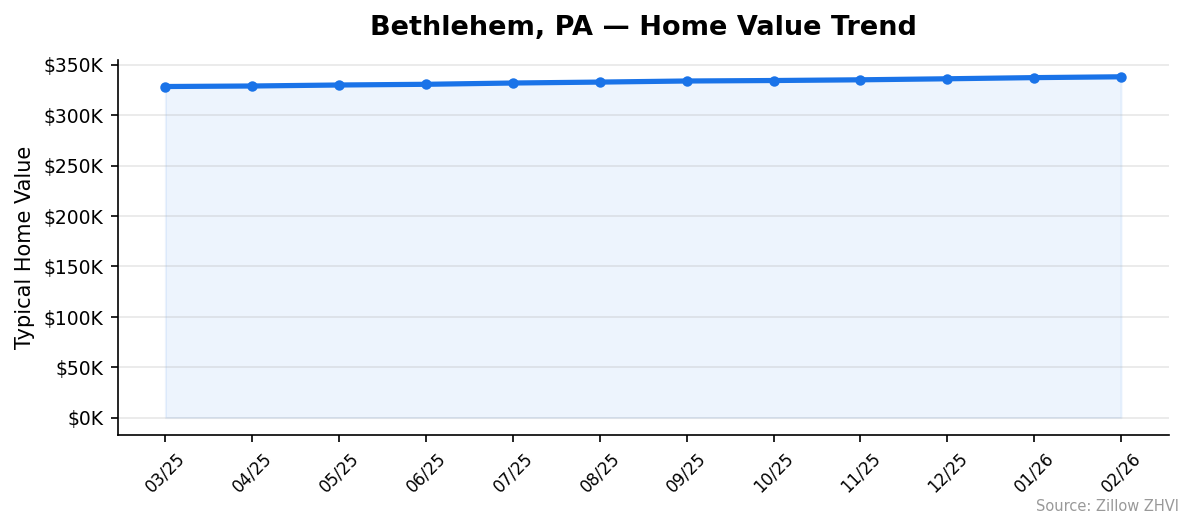
Twelve straight months of price gains. Not one month went backwards.
| Month | Avg Home Value |
|---|---|
| 2026-02 | $338,031 |
| 2026-01 | $337,203 |
| 2025-12 | $336,056 |
| 2025-11 | $335,037 |
| 2025-10 | $334,332 |
| 2025-09 | $333,855 |
| 2025-08 | $332,777 |
| 2025-07 | $331,852 |
| 2025-06 | $330,583 |
| 2025-05 | $329,887 |
| 2025-04 | $328,895 |
| 2025-03 | $328,380 |
The total gain over 12 months: $9,651, or 2.94%. The pace was steady — most months added between $700 and $1,200. There were no sudden spikes, no pullbacks.
The most recent three months (December through February) added $1,975, an annualized pace of about 2.4%. That’s slightly slower than the full-year average, but only slightly. Bethlehem’s market isn’t accelerating, but it isn’t cooling either.
For a buyer, this kind of grinding upward trend is the hardest to time. Waiting six months at the current pace would cost you roughly $5,000 in price appreciation. Waiting a year would cost something close to $10,000.
Is Bethlehem a Good Place to Buy in 2026?
The data points to a seller’s market, but a calm one.
Twelve consecutive monthly gains and 4.9% population growth over four years tell you demand is steady. There’s no sign of price weakness. At the same time, the 2.9% annual increase is modest — not the kind of frenzy that punishes buyers who need a few months to find the right house.
Affordability varies sharply by ZIP. At $279,871, ZIP 18015 is genuinely accessible. At $413,104, ZIP 18020 is closer to a stretch for the typical buyer. The right answer depends entirely on where in Bethlehem you’re looking.
For investors, the rent-to-price ratio is workable but not exciting. ZIP 18015 produces about $20,800 in annual rent against a $279,871 purchase — a gross yield of 7.4% before expenses. ZIP 18017 yields about 6.6%. Both numbers leave room for returns once taxes, maintenance, and vacancy are subtracted, but they don’t scream bargain.
If you’re a first-time buyer with stable income and a long time horizon, the math works. If you’re hoping for a price drop, the trend says don’t count on one.
Bethlehem Housing Market Outlook for 2026-2027
If the current pace continues, Bethlehem prices will keep climbing through the rest of 2026 and into 2027. The 12-month trend has been remarkably consistent — every single month posted a gain, and the monthly increases stayed in a narrow band.
The 3-month trend suggests slightly slower momentum heading into spring 2026 than the full-year average, but the deceleration is small. There’s no signal in the data of a turning point.
Population growth at 4.9% over four years remains a structural support for demand. Unless that reverses sharply or interest rates move significantly, the path of least resistance for prices is up — at a pace closer to inflation than to the boom years.
Buyers waiting for a correction should look at the data: 12 months in a row of gains, no down months. Sellers have time on their side, but there’s no rush either.
Similar Markets in PA
If you’re weighing options elsewhere in Pennsylvania, a few comparisons are worth running:
- Allentown — Bethlehem’s neighbor in the same metro, often the first comparison buyers make.
- Easton — the third leg of the Allentown-Bethlehem-Easton metro.
- Lancaster — a smaller city to the south with slower population growth.
- Reading — historically more affordable than the Lehigh Valley.
- Philadelphia — the big-city option, with an entirely different price structure.
Frequently Asked Questions
What is the average home price in Bethlehem?
The average home price in Bethlehem, PA is $338,031 as of February 2026. That number is the Zillow Home Value Index average across four ZIP codes — 18015, 18017, 18018, and 18020.
Are home prices going up or down in Bethlehem?
Prices are up 2.9% over the past 12 months and have risen every single month in the past year. The market has gone from $328,380 in March 2025 to $338,031 in February 2026 — a steady, slow climb rather than a spike.
Is it cheaper to rent or buy in Bethlehem?
Renting is cheaper today by about $400 to $600 a month. The average rent across three Bethlehem ZIPs is $1,838, while a mortgage on a $338K home runs roughly $2,200 to $2,400 once taxes and insurance are added. Buying becomes more attractive over a 7+ year horizon as you build equity.
What is the most affordable neighborhood in Bethlehem?
ZIP 18015 is the cheapest at $279,871, about 17% below the city average. It also has the lowest rent at $1,732 a month, making it the most affordable Bethlehem ZIP whether you’re buying or renting.
Methodology
Home values are based on the Zillow Home Value Index (ZHVI), a smoothed measure of typical home values in the 35th to 65th percentile range. Rent estimates use the Zillow Observed Rent Index (ZORI). Population figures come from the U.S. Census Bureau Population Estimates Program (2020-2024 vintage). All datasets are publicly available. Housing data updated 2026-02-28.