Champaign Home Prices: $230K, Up 5.4% — 3 ZIPs Analyzed (2026)
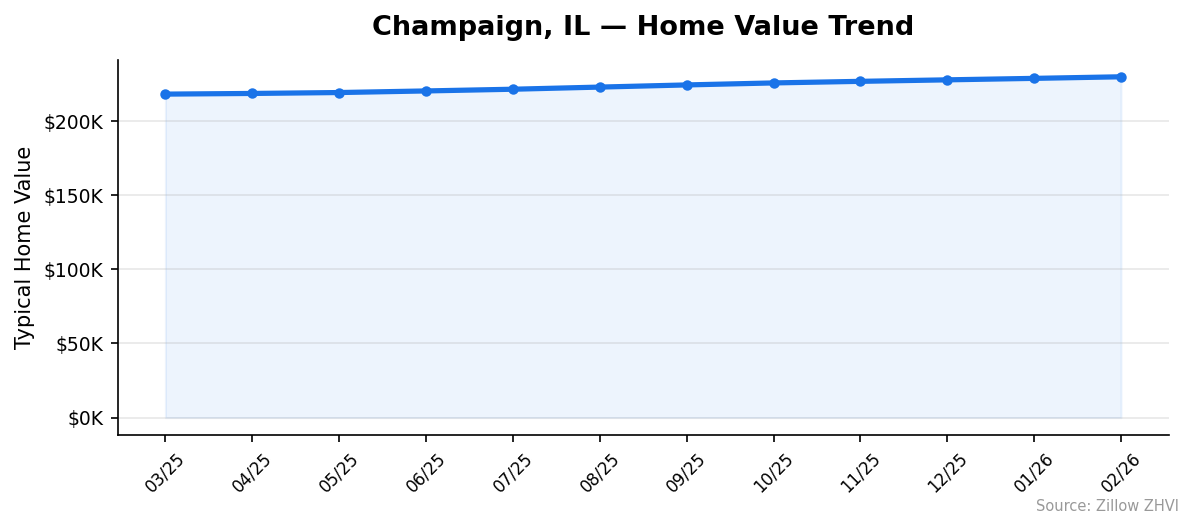
$229,955. That’s what a typical home costs in Champaign, IL as of February 2026. Prices are up 5.4% from a year ago, and the climb has been steady — every month in the trailing 12 has posted a higher value than the one before.
Quick answer: The average home price in Champaign, IL is $229,955 as of February 2026, up 5.4% year over year according to Zillow.
Current Home Prices in Champaign
The Champaign market sits well below the national median. Buyers here pay roughly half what someone in a coastal metro would, and the trajectory keeps pointing up.
| Metric | Value |
|---|---|
| Median home value | $229,955 |
| Year-over-year change | +5.4% |
| Cheapest ZIP | $173,407 (61820) |
| Most expensive ZIP | $320,781 (61822) |
| Spread between ZIPs | $147,374 |
| ZIP codes analyzed | 3 |
| Data through | February 2026 |
The 5.4% annual gain outpaces wage growth in most occupations. For a buyer who waited 12 months, the same house now costs about $11,800 more.
The price spread between Champaign’s three ZIPs is wide. The most expensive ZIP costs 1.85x the cheapest. That’s a meaningful gap in a city this size, and it tells you neighborhood choice matters more than market timing here.
The trend has no soft spots. Look at the monthly numbers and you won’t find a single month of decline in the past year. That’s unusual. Many similar-sized Midwest markets have flatlined or pulled back in 2025-2026. Champaign hasn’t.
A buyer using the median price and putting 20% down ($45,991) would carry a loan of about $183,964. At today’s rates, the principal-and-interest payment lands well over $1,200 a month before property taxes — and Illinois property taxes are among the highest in the country.
Champaign Home Prices by Neighborhood
Three ZIPs cover the city, and they don’t act alike. One is dramatically more expensive than the others.
| ZIP Code | Median Value | Avg Rent (ZORI) | vs City Avg |
|---|---|---|---|
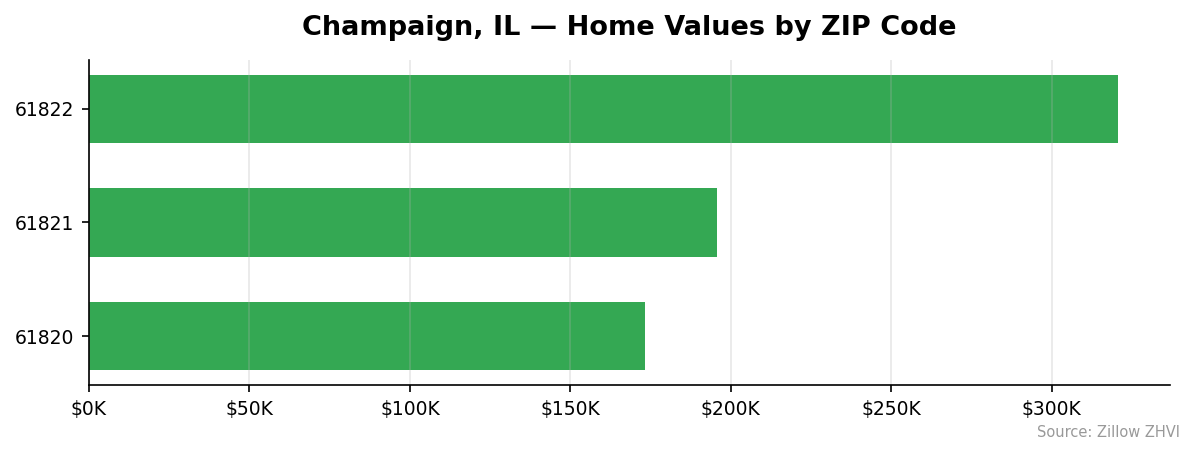
| 61820 | $173,407 | $1,137 | -25% |
| 61821 | $195,677 | $1,426 | -15% |
| 61822 | $320,781 | $1,665 | +39% |
Most Expensive
61822 — $320,781. This ZIP carries the highest values in Champaign by a wide margin, sitting 39% above the citywide average. Rent here also tops the list at $1,665, suggesting the housing stock skews newer or larger.
61821 — $195,677. The middle tier. Prices land 15% below the city average, and rent of $1,426 puts it between the other two ZIPs.
61820 — $173,407. Technically the third “most expensive” because there are only three ZIPs, but functionally the cheapest.
Most Affordable
61820 — $173,407. The lowest median price in the city, 25% below the citywide figure. Average rent of $1,137 is also the lowest, which often indicates a denser, older housing stock or a higher share of student-oriented rentals near the University of Illinois.
61821 — $195,677. Second-cheapest. A buyer who can stretch from 61820 to 61821 picks up about $22,000 in extra home value.
61822 — $320,781. Far from affordable, but listed for completeness.
Rent vs Buy in Champaign
Renting wins on monthly cash flow. Average rent across Champaign’s three ZIPs runs from $1,137 in 61820 to $1,665 in 61822.
A buyer purchasing at the $229,955 median with 20% down would carry a $183,964 loan. Even at a moderate 6.5% rate, principal and interest alone runs about $1,162 a month. Add Illinois property taxes (often 2-2.5% of assessed value annually, or $380-$480 a month for a $230K home), plus insurance ($100-$150) and maintenance reserves ($150-$200), and the all-in monthly cost reaches $1,800 to $1,990.
Compare that to renting:
| Option | Monthly Cost | Cheapest ZIP | Most Expensive ZIP |
|---|---|---|---|
| Rent | $1,137-$1,665 | 61820 | 61822 |
| Buy (median) | ~$1,800-$1,990 all-in | — | — |
Renting beats buying by $300-$700 a month at the median. But that math ignores equity. A buyer paying down principal at 5%+ annual appreciation builds wealth the renter doesn’t.
The break-even depends on how long you stay. With Champaign appreciating at 5.4% annually, a buyer who holds five years likely comes out ahead. Anyone planning to leave within two or three years — common for graduate students, post-docs, and short-term faculty — should rent.
Population Growth and Migration
Champaign added residents every year from 2020 to 2024.
| Year | Population |
|---|---|
| 2020 | 88,396 |
| 2021 | 89,330 |
| 2022 | 89,641 |
| 2023 | 90,730 |
| 2024 | 91,961 |
That’s a 4.0% gain over four years — modest in absolute terms, but striking in context. Most central Illinois cities are losing population. Champaign is gaining.
Compare it to other Illinois cities:
| City | 2024 Population | 4-Year Growth |
|---|---|---|
| Aurora | 180,710 | +0.2% |
| Naperville | 153,124 | +2.5% |
| Joliet | 151,837 | +1.0% |
| Elgin | 114,701 | 0.0% |
| Champaign | 91,961 | +4.0% |
| Waukegan | 88,570 | -0.6% |
Champaign’s growth rate beats every comparison city on this list. Even Naperville — a Chicago suburb often cited as a growth magnet — added residents at a slower pace.
The University of Illinois is the obvious anchor. Steady enrollment, faculty hiring, and a research economy translate into housing demand that doesn’t depend on national job-market swings. That’s part of why prices keep climbing here while flatter Midwestern markets have stalled.
For housing, growing population plus tight supply equals upward pressure. The 5.4% annual price gain isn’t an anomaly. It’s what you’d expect from these inputs.
Champaign Housing Market Trends
Twelve straight months of gains. No retreat.
| Month | Median Value | Monthly Change |
|---|---|---|
| Feb 2026 | $229,955 | +0.5% |
| Jan 2026 | $228,889 | +0.4% |
| Dec 2025 | $227,894 | +0.4% |
| Nov 2025 | $226,880 | +0.5% |
| Oct 2025 | $225,811 | +0.5% |
| Sep 2025 | $224,460 | +0.7% |
| Aug 2025 | $223,006 | +0.7% |
| Jul 2025 | $221,562 | +0.5% |
| Jun 2025 | $220,408 | +0.5% |
| May 2025 | $219,326 | +0.3% |
| Apr 2025 | $218,712 | +0.2% |
| Mar 2025 | $218,264 | — |
Total 12-month gain: $11,691, or 5.4%.
The pace accelerated mid-year. From March through May 2025, monthly gains averaged just 0.3%. Then summer arrived and the market sped up — June through September posted 0.5% to 0.7% monthly gains, the strongest stretch of the year. Things have cooled slightly since, with the most recent three months running at 0.4-0.5%.
Steady, not explosive. That pattern matters for buyers trying to time entry. There’s no obvious “wait it out” signal in this data.
Is Champaign a Good Place to Buy in 2026?
The data points to a seller’s market. Twelve consecutive monthly gains, 5.4% annual appreciation, growing population, and a stable institutional anchor all push in the same direction.
That said, “seller’s market” doesn’t mean “bad time to buy.” It means buyers have less room to push back on price than they would in flat or declining markets. With Champaign’s median at $229,955 — well below national figures — affordability is still strong relative to most of the country.
Who should buy: long-term residents (5+ years), faculty and staff with stable employment, families settling near the university. Who should rent: graduate students with uncertain timelines, anyone unsure they’ll stay past 2-3 years, buyers stretching to afford 61822.
The 39% premium for 61822 deserves scrutiny. If you’re not committed to that specific area, 61821 offers similar utility at $125,000 less.
Champaign Housing Market Outlook for 2026-2027
The 3-month trend suggests continued upward pressure. November 2025 through February 2026 averaged 0.45% monthly gains — annualized, that’s about 5.5%, almost identical to the trailing 12-month figure.
If the current pace continues, the median home value would cross $240,000 by late 2026. Whether that holds depends on factors outside this dataset: mortgage rates, university enrollment, and broader Illinois economic conditions.
The momentum visible in the monthly data shows no breaks. There are no months of decline, no flattening, no obvious cooling signal. Markets that have been climbing this consistently rarely reverse abruptly.
The 12-month look-ahead from this data alone: prices probably keep rising, though monthly gains may moderate from the summer 2025 pace. Buyers waiting for a pullback should know the data doesn’t support that strategy yet.
Similar Markets in IL
If you’re comparing Champaign to other Illinois options:
- Bloomington — another central Illinois college town, often the closest comparison to Champaign on size and economy.
- Naperville — a higher-priced Chicago suburb worth checking if you want a sense of how much premium you’d pay for the metro.
- Aurora — larger Chicago-area market with very different growth dynamics than Champaign.
- Decatur — a downstate option that typically runs cheaper than Champaign.
- Chicago — the obvious benchmark for any Illinois housing comparison.
Frequently Asked Questions
What is the average home price in Champaign?
The average home price in Champaign, IL is $229,955 as of February 2026. That figure is the Zillow Home Value Index across the city’s three ZIP codes. Individual neighborhoods range from $173,407 in 61820 to $320,781 in 61822.
Are home prices going up or down in Champaign?
Up. Champaign home prices rose 5.4% in the past year, with steady monthly gains across all 12 months in the trailing year. There is no month of decline in the recent data.
Is it cheaper to rent or buy in Champaign?
Renting is cheaper on a monthly basis. Average rent runs $1,137 to $1,665 across the three ZIPs, while the all-in cost of buying the median home (mortgage, taxes, insurance, maintenance) runs roughly $1,800-$1,990 per month. Buying makes more sense for residents staying 5+ years because of equity buildup.
What is the most affordable neighborhood in Champaign?
ZIP 61820 has the lowest median home value in the city at $173,407 — about 25% below the citywide average. Rent there also runs lowest at $1,137 per month, suggesting denser or older housing stock.
Methodology
Home values are based on the Zillow Home Value Index (ZHVI), a smoothed measure of typical home values in the 35th to 65th percentile range. Rent estimates use the Zillow Observed Rent Index (ZORI). Population figures come from the U.S. Census Bureau Population Estimates Program (2020-2024 vintage). All datasets are publicly available. Housing data updated 2026-02-28.