Moreno Valley Home Prices: $552K, Down 1.5% — 4 ZIPs Analyzed (2026)
$552,149. That’s what a typical home in Moreno Valley costs right now — and it’s actually less than it was a year ago. Prices are down 1.5% year over year, breaking from the relentless upward march that defined the Inland Empire for years. For buyers who’ve been priced out, this is the first real breathing room in a while.
Quick answer: The average home price in Moreno Valley, CA is $552,149 as of February 2026, down 1.5% year over year according to Zillow.
Current Home Prices in Moreno Valley
Here’s where things stand in Moreno Valley as of February 2026:
| Metric | Value |
|---|---|
| Median Home Value | $552,149 |
| Year-over-Year Change | -1.5% |
| Lowest ZIP Median | $511,910 |
| Highest ZIP Median | $607,998 |
| Number of ZIP Codes | 4 |
That 1.5% annual decline may not sound like much, but in dollar terms it means the typical home is worth roughly $8,400 less than it was in early 2025. The price range across the city spans nearly $96,000 from the most affordable to the priciest neighborhoods.
Moreno Valley sits in the Riverside-San Bernardino-Ontario metro, where it has long served as one of the more affordable gateways into Southern California homeownership. The current median of $552,149 still puts it below many coastal California markets, but it’s a far cry from the bargain prices the city was known for a decade ago.
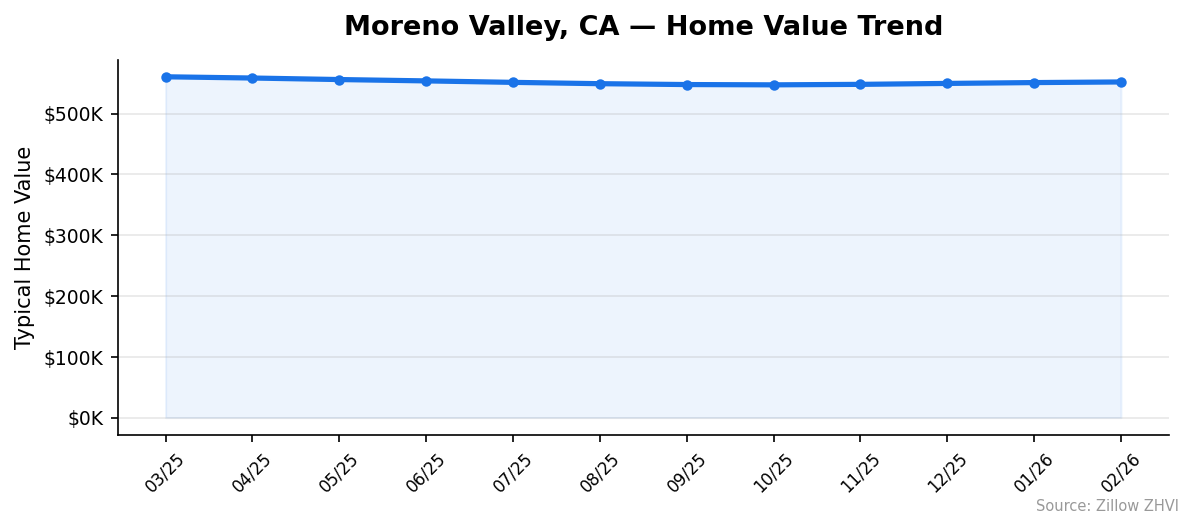
The year-over-year decline tells you the market has cooled. Prices peaked in March 2025 at $560,653, then slid through the summer and fall before stabilizing. February’s number shows a modest uptick from the October low, suggesting the worst of the correction may be behind us.
Moreno Valley Home Prices by Neighborhood
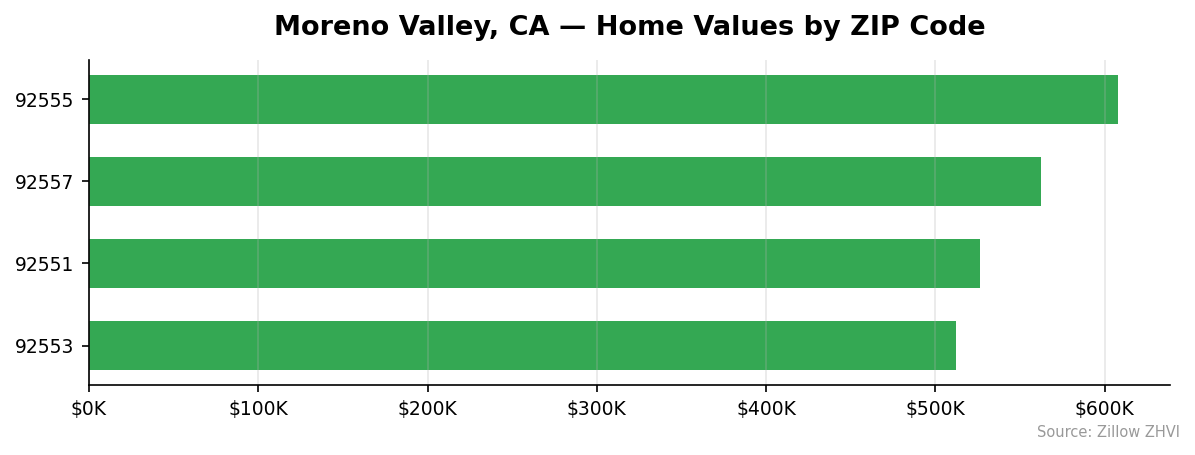
Moreno Valley’s four ZIP codes show meaningful price differences depending on where you buy.
| ZIP Code | Median Home Value | Avg Monthly Rent |
|---|---|---|
| 92553 | $511,910 | $2,213 |
| 92551 | $526,182 | $2,344 |
| 92557 | $562,506 | $2,681 |
| 92555 | $607,998 | $2,558 |
Most Expensive
92555 leads at $607,998 — about $56,000 above the city median. Despite the highest price tag, rents here run $2,558, actually lower than 92557. That gap between home values and rents signals stronger equity appreciation expectations among buyers.
92557 comes in at $562,506 with the highest rents in the city at $2,681 per month. This ZIP carries a roughly $10,000 premium over the city average.
Most Affordable
92553 is the entry point at $511,910, roughly $40,000 below the city median. Rents are the lowest too at $2,213, making this the most budget-friendly area in Moreno Valley across both buying and renting.
92551 offers the second-lowest prices at $526,182. Rents here sit at $2,344 — moderate by Moreno Valley standards and roughly $337 less per month than the priciest rental ZIP.
Rent vs Buy in Moreno Valley
The rent-versus-buy math in Moreno Valley leans toward renting on pure monthly cost. Here’s the comparison:
| Cost Type | Monthly Amount |
|---|---|
| Average Rent (all ZIPs) | ~$2,449 |
| Mortgage Payment (20% down, 7%) | ~$2,940 |
| Estimated Taxes & Insurance | ~$575 |
| Total Ownership Cost | ~$3,515 |
A 20% down payment on the median $552,149 home means $110,430 upfront, leaving a $441,719 loan. At a 7% rate over 30 years, that’s roughly $2,940 per month in principal and interest alone. Add property taxes and insurance and you’re looking at about $3,515.
That’s $1,066 more per month than the average rent.
The cheapest rent-to-own gap is in 92553, where rent averages $2,213 and median home values sit at $511,910. The widest gap is in 92557, where high rents of $2,681 close the distance with ownership costs.
Renting saves you money monthly. But with prices down 1.5% year over year, buyers who can afford the higher payment may find this a better entry point than a year ago. The real question is whether prices have further to fall.
Population Growth and Migration
Moreno Valley’s population reached 213,919 in 2024, up 2.4% from 208,862 in 2020. The city is growing steadily, adding about 1,250 residents per year.
| Year | Population |
|---|---|
| 2020 | 208,862 |
| 2021 | 210,924 |
| 2022 | 211,851 |
| 2023 | 212,770 |
| 2024 | 213,919 |
Growth has been consistent — no year saw a decline. The pace picked up slightly in 2024, with 1,149 new residents compared to 919 the year before.
How does Moreno Valley compare to other California cities?
| City | 2024 Population | 4-Year Growth |
|---|---|---|
| San Diego | 1,404,452 | 1.4% |
| Fresno | 550,105 | 1.4% |
| Sacramento | 535,798 | 1.9% |
| Oakland | 443,554 | 0.6% |
| Bakersfield | 417,468 | 3.0% |
| Moreno Valley | 213,919 | 2.4% |
Moreno Valley is growing faster than San Diego, Fresno, Sacramento, and Oakland. Only Bakersfield outpaces it at 3.0%. That steady population growth means sustained housing demand — more people competing for the same housing stock. Even with prices softening, the demographic pressure hasn’t let up.
Moreno Valley Housing Market Trends
The 12-month price trend tells a clear story: peak, decline, and early recovery.
| Month | Average Value | Low | High |
|---|---|---|---|
| Mar 2025 | $560,653 | $520,097 | $616,098 |
| Apr 2025 | $558,620 | $517,988 | $614,326 |
| May 2025 | $556,110 | $515,380 | $611,995 |
| Jun 2025 | $553,901 | $513,095 | $610,103 |
| Jul 2025 | $551,481 | $510,842 | $607,729 |
| Aug 2025 | $549,308 | $508,783 | $605,390 |
| Sep 2025 | $547,884 | $507,487 | $603,658 |
| Oct 2025 | $547,406 | $507,012 | $602,755 |
| Nov 2025 | $548,197 | $507,740 | $603,392 |
| Dec 2025 | $549,740 | $509,086 | $605,099 |
| Jan 2026 | $551,128 | $510,523 | $606,859 |
| Feb 2026 | $552,149 | $511,910 | $607,998 |
From the March 2025 peak of $560,653 to the October 2025 trough of $547,406, prices dropped $13,247 — a 2.4% decline over seven months. Since then, prices have climbed back $4,743 over four months.
The recovery is slow. Monthly gains since October have averaged about $1,186. That’s modest, but the direction has been consistent — four straight months of increases. The floor appears to have been established in the $547,000 range.
Is Moreno Valley a Good Place to Buy in 2026?
The data points to a buyer-friendly window. Prices are 1.5% below last year’s level, and the market just came off a seven-month correction. You’re buying closer to the bottom than the top.
Here’s what works in a buyer’s favor: the median sits at $552,149, well below many Southern California alternatives. The four-month recovery trend is gradual, so there’s no urgency-driven bidding frenzy pushing prices up fast. And with the cheapest ZIP (92553) under $512,000, there are entry points for different budgets.
What works against you: mortgage rates around 7% make monthly payments steep. The $3,515 estimated ownership cost is $1,066 above average rent. And the population keeps growing at 2.4%, which puts a floor under prices.
For buyers with a long hold period — five years or more — current prices represent a reasonable entry. Short-term speculators face more risk given the flat-to-declining trend.
Moreno Valley Housing Market Outlook for 2026-2027
The four-month upward trend from October 2025 through February 2026 suggests prices are stabilizing, not crashing. Monthly gains have been small but steady — averaging about $1,186 per month.
If the current pace continues through mid-2026, the median could reach the $555,000-$558,000 range by summer. That would still be below the March 2025 peak of $560,653.
The 3-month trend suggests the sharp correction is over. But the recovery is too slow to call this a seller’s market anytime soon. Expect a flat-to-slightly-up pattern through the rest of 2026, barring major shifts in mortgage rates or the broader economy.
With population growth holding steady and no surge in new construction, the conditions for a major price drop aren’t present. But neither are the conditions for a rapid rebound. Sideways is the most likely path.
Similar Markets in CA
If you’re comparing options across California, here are similar markets worth a look:
- Fontana — A fellow Inland Empire city just 20 miles west, offering a direct comparison for San Bernardino County buyers.
- Riverside — The county seat and closest major neighbor to Moreno Valley, with a similar price profile.
- Bakersfield — Growing faster than Moreno Valley at 3.0% population growth, typically at a lower price point.
- Long Beach — A step up in price but closer to Los Angeles job centers and the coast.
- Chula Vista — Another Southern California suburb with strong population growth near San Diego.
Frequently Asked Questions
What is the average home price in Moreno Valley?
The average home price in Moreno Valley is $552,149 as of February 2026. Prices range from $511,910 in ZIP code 92553 to $607,998 in ZIP code 92555. That’s a $96,088 spread across the city’s four ZIP codes.
Are home prices going up or down in Moreno Valley?
Prices are down 1.5% year over year. The market peaked in March 2025 at $560,653 and bottomed in October 2025 at $547,406. Since October, prices have risen for four straight months, suggesting the decline has ended and a slow recovery is underway.
Is it cheaper to rent or buy in Moreno Valley?
Renting is cheaper on a monthly basis. The average rent across Moreno Valley is roughly $2,449 per month. A mortgage on the median-priced home with 20% down at 7% runs about $2,940 in principal and interest alone — roughly $3,515 when you add taxes and insurance. That’s about $1,066 more per month than renting.
What is the most affordable neighborhood in Moreno Valley?
ZIP code 92553 is the most affordable with a median home value of $511,910, which is $40,239 below the city average. Average rent in 92553 is also the lowest at $2,213 per month, making it the budget-friendly pick for both buyers and renters.
Methodology
Home values are based on the Zillow Home Value Index (ZHVI), a smoothed measure of typical home values in the 35th to 65th percentile range. Rent estimates use the Zillow Observed Rent Index (ZORI). Population figures come from the U.S. Census Bureau Population Estimates Program (2020-2024 vintage). All datasets are publicly available. Housing data updated 2026-02-28.